On-Call Agent
The On-Call Agent automates troubleshooting and remediation for your degraded Argo CD applications and Kubernetes namespaces by executing predefined runbooks. An incident is an investigation of a namespace or app in a degraded state. Incidents are either kicked off automatically by the On-Call Agent upon a detected degraded state or manually when a user converts a conversation to an incident. Once the incident is created, the On-Call Agent will begin troubleshooting and triage. An incident follows the same pattern as a conversation with the Deployment Advisor with a couple of key differences:
- There is a status associated with the incidents, resolved / active
- Incidents are associated with a particular resource (E.g., an Argo CD application or a Kubernetes Namespace)
Incidents are either kicked off automatically by the On-Call Agent upon a detected degraded state or manually when a user converts a conversation to an incident.
Enable Incident Auto-Creation
From the Intelligence settings page, you can configure the conditions under which an incident is automatically created when your Argo CD applications or Kubernetes resources enter a degraded state.
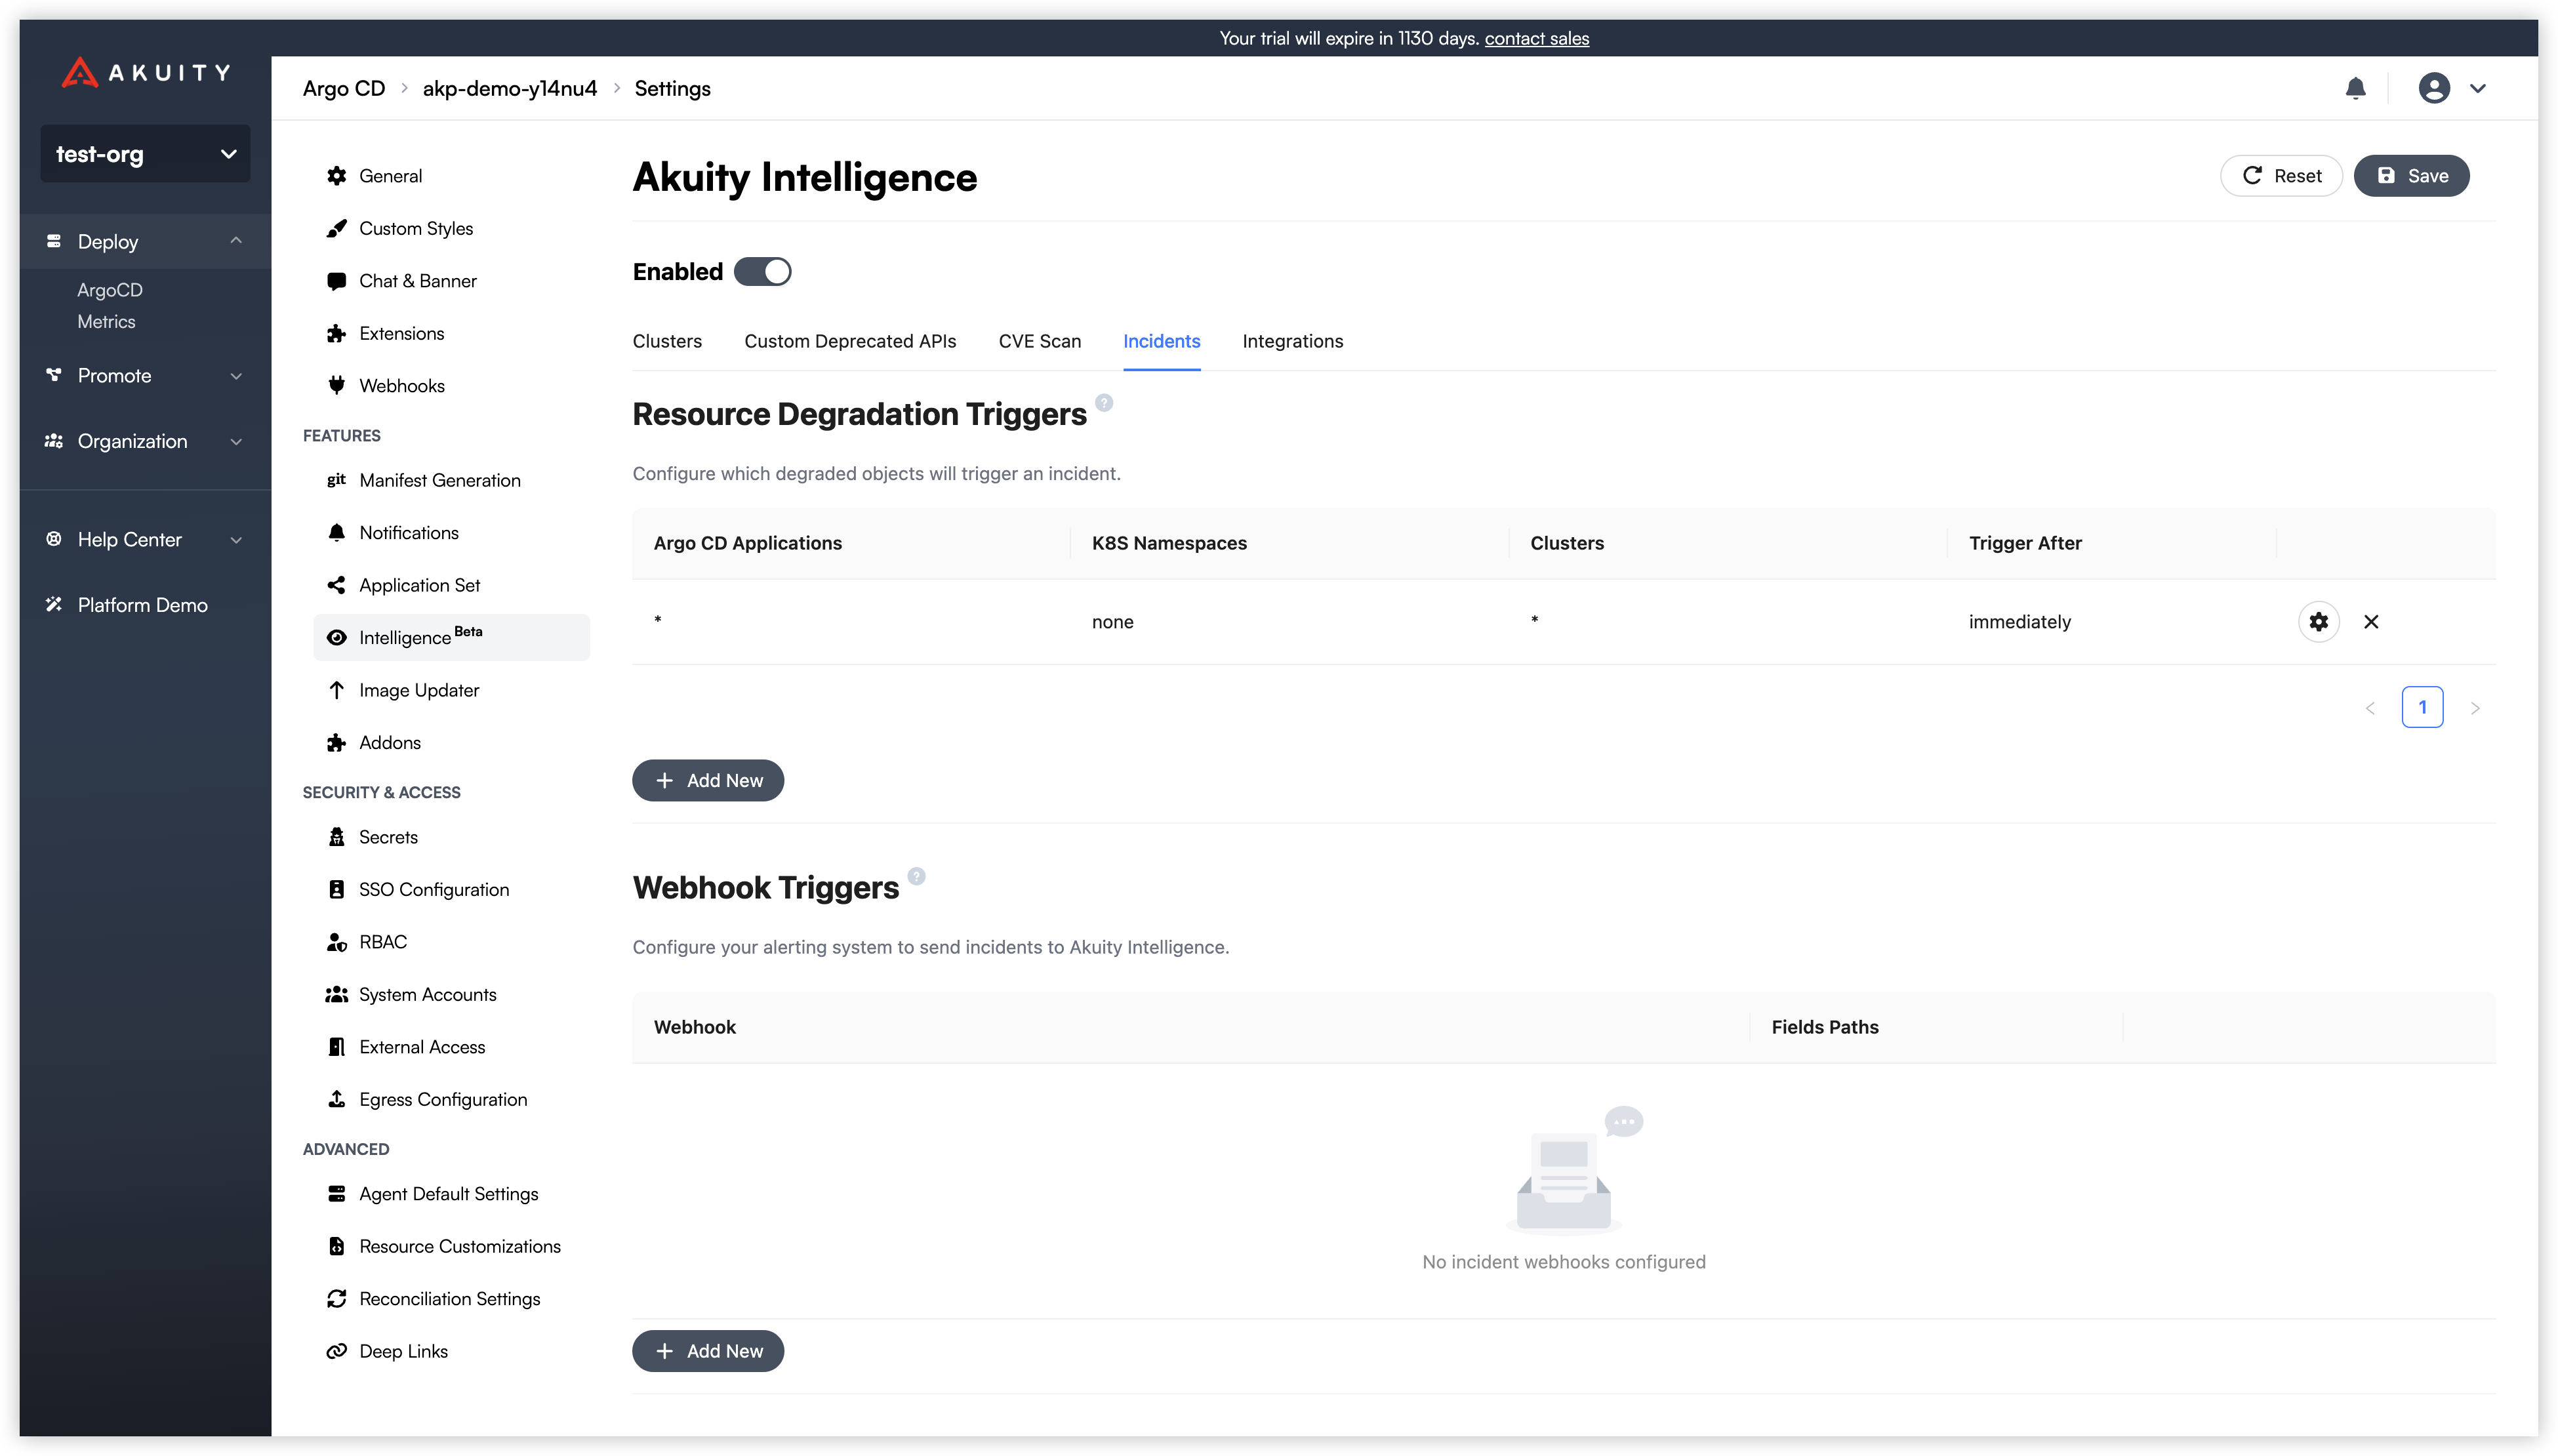
Resource Degradation Triggers allow you to automatically create incidents when your Argo CD applications or Kubernetes resources enter a degraded state.
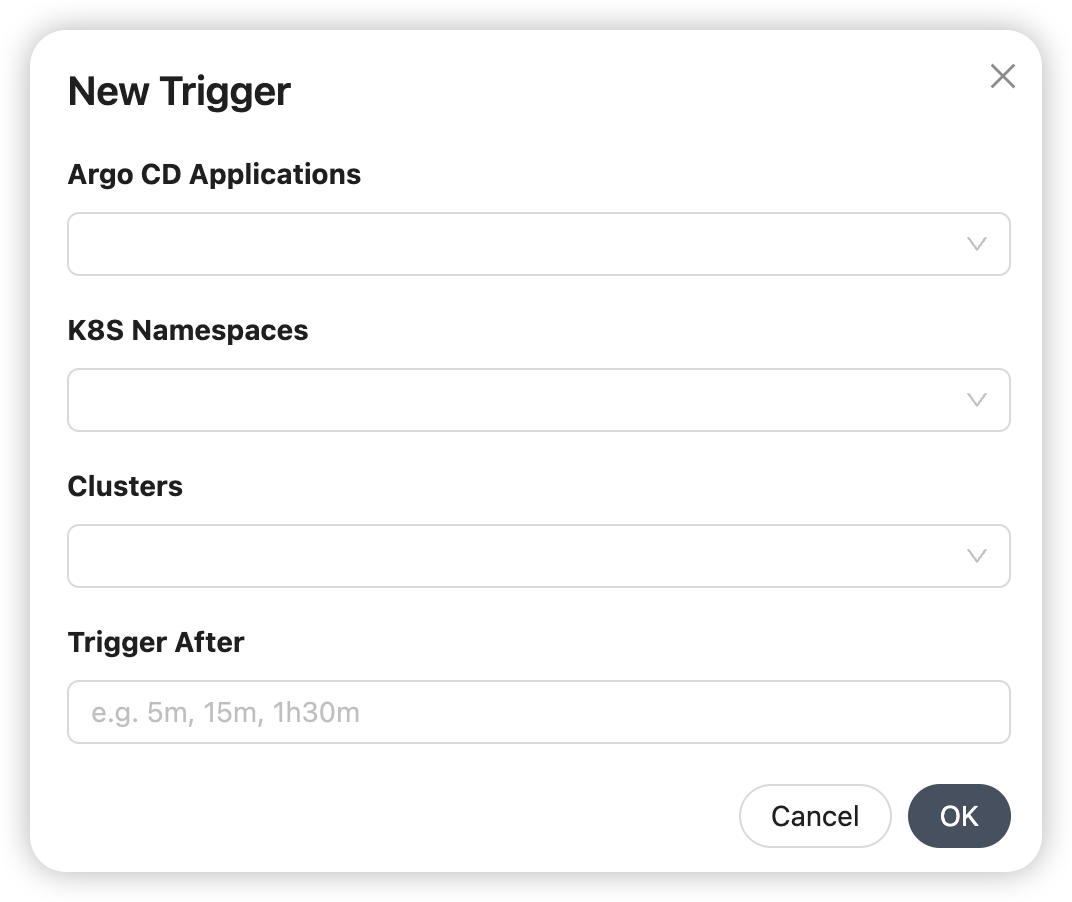
To create a trigger:
- Click Add New under the Resource Degradation Triggers section.
- Fill in the following fields in the "New Trigger" dialog:
- Argo CD Applications: Select which specific Argo CD applications to monitor.
- K8S Namespaces: Select which Kubernetes namespaces to monitor.
- Clusters: Choose the cluster(s) this trigger will apply to.
- Trigger After: Specify a delay (e.g., 5m, 15m, 1h30m) before creating an incident. This prevents alerts for brief, transient issues.
Webhook triggers
Webhook triggers let you create incidents from alerts sent by external monitoring systems such as Prometheus Alertmanager, Grafana, Datadog, or any tool that can send an HTTP POST request. When the Akuity Platform receives a webhook, it extracts incident metadata from the JSON payload using JSONPath expressions you define and creates an incident for the On-Call Agent to investigate.
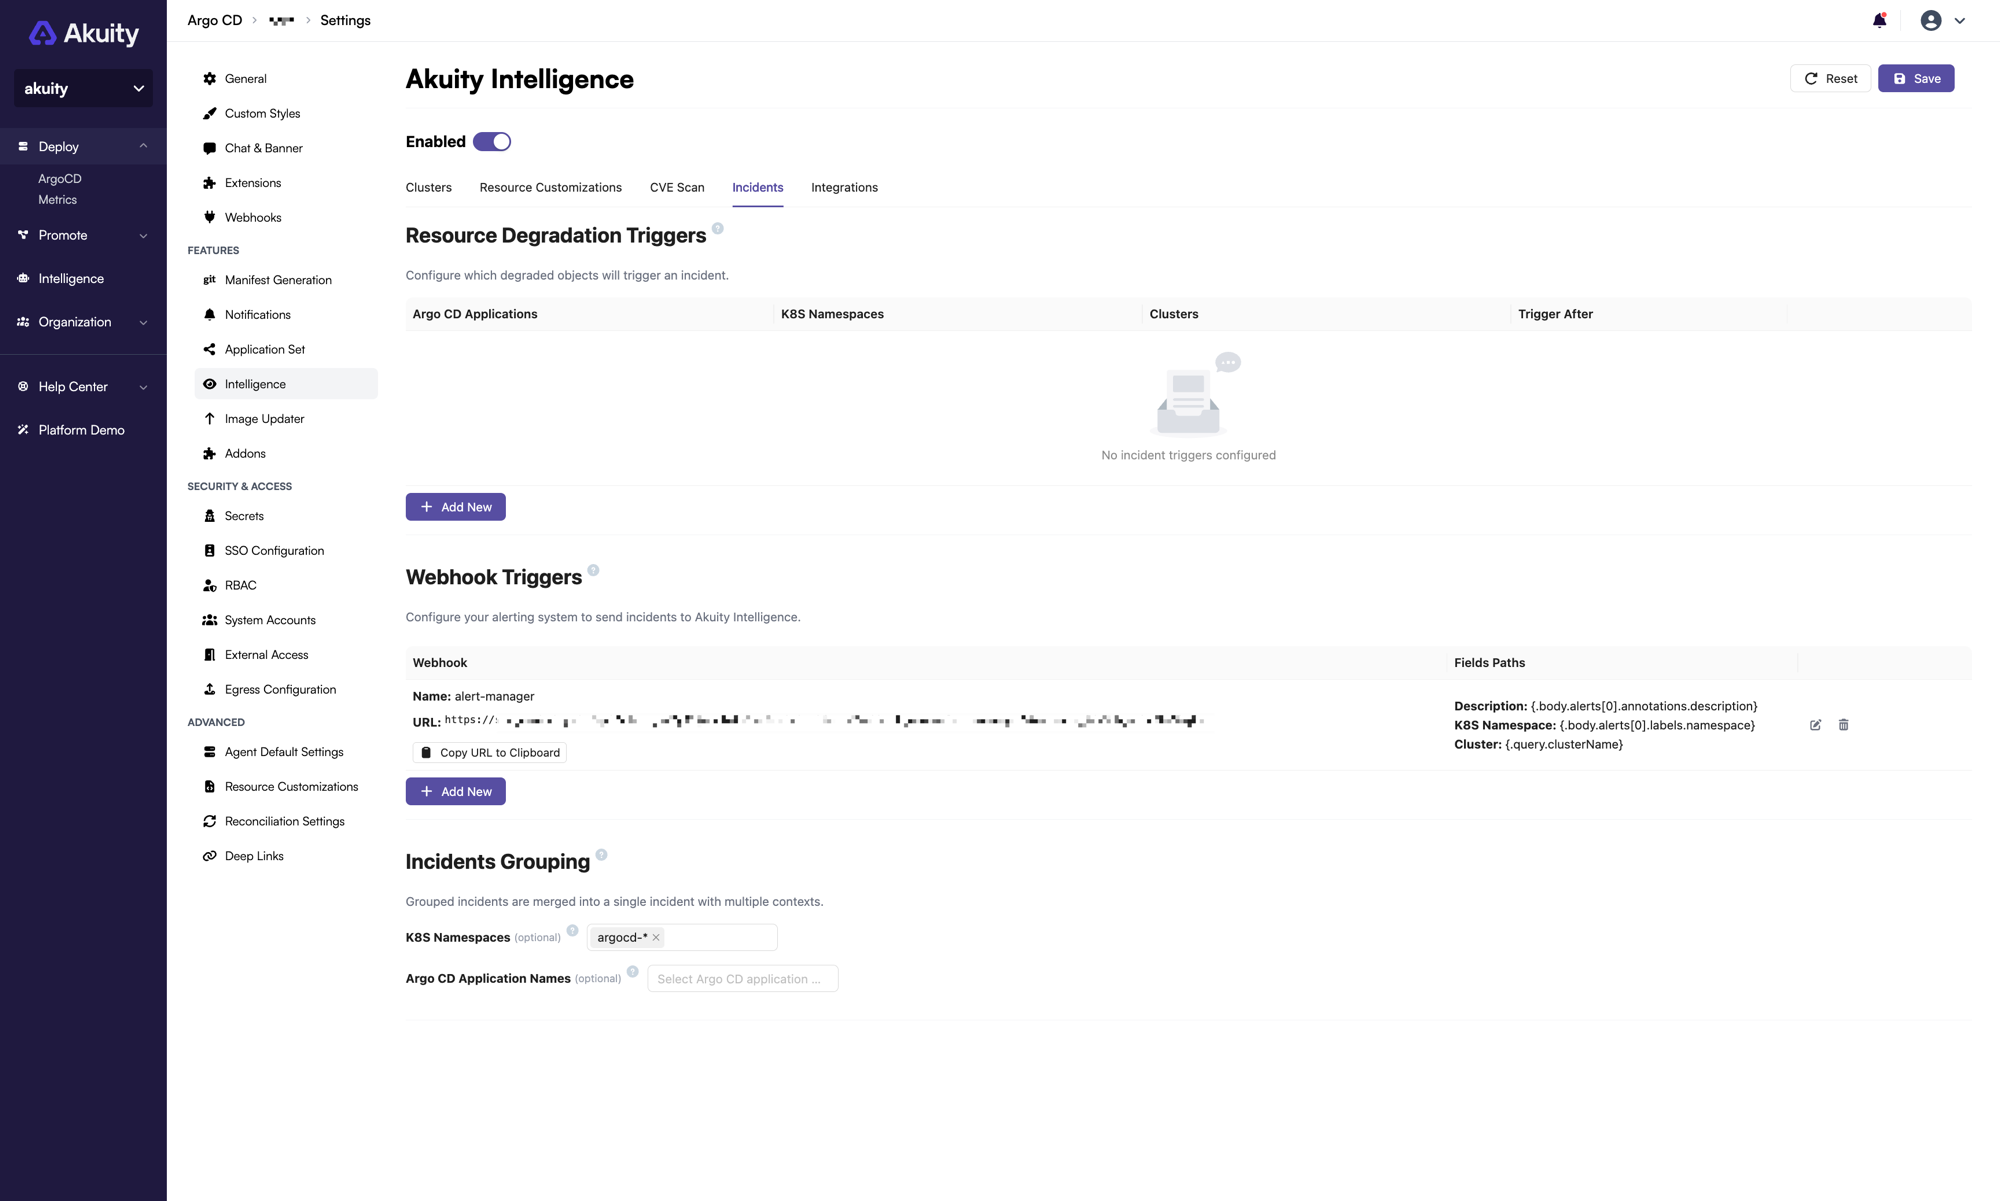
Configure a webhook trigger
From the Intelligence settings page, under the Webhook Triggers section:
-
Click Add New.
-
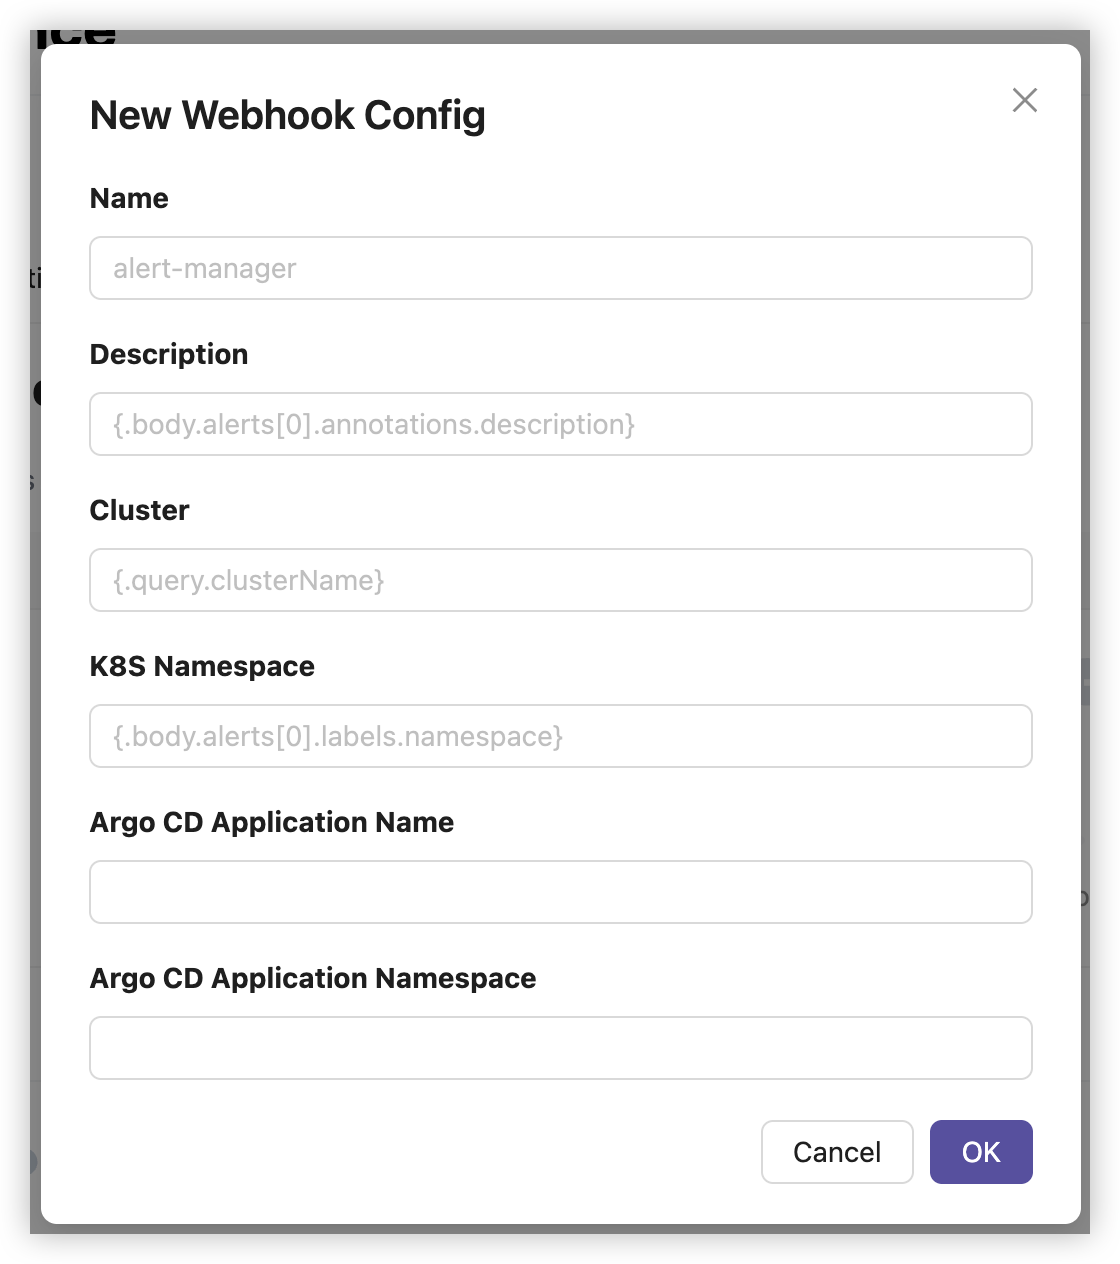
In the New Webhook Config dialog, fill in the following fields:
-
Name (required): A unique identifier for this webhook configuration (e.g.,
alert-manager). -
Description: A JSONPath expression that maps to the incident summary from the webhook payload (e.g.,
{.body.alerts[0].annotations.description}). -
Cluster: A JSONPath expression that maps to the cluster name. This can reference query parameters as well (e.g.,
{.query.clusterName}). -
K8s Namespace: A JSONPath expression that maps to the Kubernetes namespace (e.g.,
{.body.alerts[0].labels.namespace}). -
Argo CD Application Name: A JSONPath expression that maps to the Argo CD application name.
-
Argo CD Application Namespace: A JSONPath expression that maps to the Argo CD application namespace. If an application name is provided but the namespace is omitted, it defaults to
argocd.
-
-
Click OK to save the configuration.
-
Click Save in the top-right corner to apply the changes.
After saving, the dashboard displays a generated webhook URL next to each configuration. Copy this URL and configure it in your alerting system as the target endpoint.
Webhook URL format
Each webhook trigger produces a URL in the following format:
https://<hostname>/api/v1/orgs/<organization_id>/ai/incidents?webhook_name=<webhook_name>&instance_id=<instance_id>
organization_id: Your Akuity organization ID.webhook_name: The name you assigned to the webhook configuration.instance_id: The Argo CD instance ID associated with this trigger.
The endpoint accepts a POST request. The request body must be a valid JSON payload. The Akuity Platform evaluates the JSONPath expressions you configured against the payload to extract incident metadata.
Authentication
All webhook requests must be authenticated. Unauthenticated requests will be rejected.
The webhook endpoint uses HTTP Basic Authentication. Set the username to your API Key ID and the password to your API Key Secret. The API key must have the Organization Owner role, or a custom role with Akuity Intelligence create permission.
To create an API key, see API Keys.
JSONPath expressions
Field mappings use Kubernetes-style JSONPath syntax. The expressions are evaluated against a root object that contains two keys:
body: The parsed JSON body of the incoming webhook request.query: A map of query parameters from the request URL.
For example, if Prometheus Alertmanager sends a payload like:
{
  "alerts": [
    {
      "labels": {
        "namespace": "production",
        "alertname": "HighMemoryUsage"
      },
      "annotations": {
        "description": "Pod memory usage exceeds 90%"
      }
    }
  ]
}
You could use the following JSONPath expressions:
| Field | JSONPath expression |
|---|---|
| Description | {.body.alerts[0].annotations.description} |
| K8s Namespace | {.body.alerts[0].labels.namespace} |
| Cluster | {.query.clusterName} |
In this example, the cluster name is passed as a query parameter. Your alerting system would send the webhook to:
https://<hostname>/api/v1/orgs/<org_id>/ai/incidents?webhook_name=alert-manager&instance_id=<id>&clusterName=my-cluster
If a JSONPath expression matches multiple values, they are joined with commas. If a field's JSONPath is left empty, the corresponding incident field is left blank.
Example: Prometheus Alertmanager
To integrate with Prometheus Alertmanager, add a webhook receiver to your Alertmanager configuration:
receivers:
  - name: akuity-intelligence
    webhook_configs:
      - url: "https://<hostname>/api/v1/orgs/<org_id>/ai/incidents?webhook_name=alert-manager&instance_id=<instance_id>&clusterName=my-cluster"
        send_resolved: true
        http_config:
          basic_auth:
            username: <akuity-api-key-id>
            password: <akuity-api-key-secret>
Then configure the corresponding webhook trigger in the Akuity Platform with the following field mappings:
| Field | JSONPath expression |
|---|---|
| Description | {.body.alerts[0].annotations.description} |
| K8s Namespace | {.body.alerts[0].labels.namespace} |
| Cluster | {.query.clusterName} |
| Argo CD Application Name | {.body.alerts[0].labels.app} |
When Alertmanager fires an alert, the Akuity Platform creates an incident and the On-Call Agent begins troubleshooting using any applicable runbooks.
Create Runbooks
Runbooks, at a high level, are the instruction sets that the On-Call Agent uses when responding to an active incident or scenario. These runbooks are written and stored in markdown formatting making them easy to read between both humans and Intelligence.
There is no preset schema or format that you need to follow for a runbook, the On-Call Agent will interpret whatever you have written and assess it for actions when a corresponding incident occurs.
For example, you may have an incident in which an application has hit the memory limit and entered into an out of memory (OOM) state. Based on the runbooks you have in the environment, the On-Call Agent can perform the following:
- Identify what runbook is most applicable to the caused incident
- Report status and custom pieces to a Slack channel
- Suggest a change and wait for approval from a user
Example:
## General

- First, do the initial triage and collect the basic information to understand the incident.
- Next, send a slack notification with the link to the conversation to channel “on-call” with basic detail.
- Next, work on the incident according to the runbook. Don't take any action automatically, ask for approval.
- If the app is stable, check 30 seconds later again, then you can close the incident automatically. Please do slack all the details in concise messages.
- If you stack send a slack message again and mention that you need help.
- Please ensure you send slack message with the link to the conversation, so engineer can work with you together if needed.

## Out of memory

**Symptoms**: Pod unexpectedly dies with `OOMKilled` status.

**Root cause**: The pod is consuming more memory than the available memory.

**Solution**:

* Temporary increase the memory limit of the pod automatically
* Increase the memory limit with the 50 Mb increment until the pod is stable.
Users can manage their runbooks under the Runbooks tab of Incidents dashboard.
GitOps-Managed Runbooks
In addition to creating runbooks manually in the UI, you can connect Git repositories and let Akuity pull runbooks directly from your version-controlled markdown files. This lets you manage runbooks with the same Git workflows you use for everything else — pull requests, reviews, and history included.
Connect a Git Repository
- Navigate to Intelligence → Incidents → Runbooks.
- Click the Import dropdown and select Connect Git repo.
- In the Connect Git Repositories dialog, add one or more repository URLs.
- Repository URL (required): the HTTPS URL of your Git repository.
- Revision (optional): a branch, tag, or commit SHA. Defaults to the repository's default branch.
- Path glob (optional): a glob pattern to filter which files are fetched. Defaults to
**/*.md, which picks up all markdown files.
- Click Save. Akuity will begin syncing runbooks from the repository periodically.
The akuity-intelligence-examples repository contains a curated set of ready-to-use runbooks. Click Add next to the suggestion in the dialog to connect it instantly.
Runbook File Format
Any *.md file in the connected repository is a candidate runbook. Add a YAML front matter block at the top of the file to configure its name, targeting, and notifications. Files without front matter are still imported — they just won't be auto-triggered by the On-Call Agent.
---
name: OOM Runbook
applied_to.clusters: production, staging
applied_to.argocd_applications: my-app-*
applied_to.k8s_namespaces: default
applied_to.degraded_for: 5m
slack_channel_names: on-call, alerts
---

## Out of Memory

**Symptoms**: Pod unexpectedly dies with `OOMKilled` status.

**Solution**: Temporarily increase the memory limit by 50 MB increments until the pod stabilizes. Notify the on-call channel with a link to this incident.
Supported front matter fields:
| Field | Description |
|---|---|
name | Display name for the runbook. Defaults to the file path. |
applied_to.clusters | Comma-separated cluster name patterns. Use * to match all clusters. |
applied_to.argocd_applications | Comma-separated Argo CD application name patterns. Supports wildcards, e.g. my-app-*. |
applied_to.k8s_namespaces | Comma-separated Kubernetes namespace patterns. Supports wildcards. |
applied_to.degraded_for | Minimum duration a resource must be degraded before this runbook triggers, e.g. 5m, 1h. |
slack_channel_names | Comma-separated Slack channel names to notify when this runbook runs. |
Configuring Targeting for GitOps Runbooks
GitOps runbooks pick up their applied_to targeting from the YAML front matter inside each file. If you need to configure or override targeting without editing the source file — for example, when the repository is owned by another team, or when you want environment-specific targeting — you can set overrides directly in the Akuity UI or via Terraform.
Overrides are stored per-runbook-name inside the repository configuration and take precedence over any applied_to values in the file's front matter.
From the UI
- In the Runbooks sidebar, select a runbook that was imported from a Git repository.
- In the detail pane, click Edit Targeting.
- Configure the Argo CD Applications, K8S Namespaces, and Clusters fields exactly as you would for a manual runbook.
- Click Save. The override is stored immediately; the On-Call Agent will use it on the next incident without waiting for a repository sync.
The runbook content itself remains read-only — only the targeting is overridden. To change the content, edit the source file in your repository.
Via Terraform
Use the applied_for map inside a runbook_repos block. Each key is a runbook name (derived from the file name after stripping the extension); the value is a target selector:
resource "akp_instance" "example" {
  argocd = {
    spec = {
      instance_spec = {
        kube_vision_config = {
          ai_config = {
            runbook_repos = [
              {
                repo_url = "https://github.com/my-org/runbooks"
                revision = "main"
                applied_for = {
                  "oom-kill" = {
                    argocd_applications = ["guestbook-*"]
                    clusters            = ["prod-cluster"]
                  }
                  "restart-pod" = {
                    k8s_namespaces = ["default", "staging"]
                    clusters       = ["*"]
                  }
                }
              }
            ]
          }
        }
      }
    }
  }
}
Sync Status
Each connected repository shows a status indicator in the runbooks sidebar:
- Green — the repository was synced successfully. Hover to see the last sync time.
- Yellow — the last sync attempt failed. Hover to see the error message.
- Spinning — the repository is waiting for its first sync.
Click a repository row to open the Connect Git Repositories dialog and manage its configuration.
Permissions
For private repositories, make sure the Argo CD instance has credentials configured for the repository URL under Settings → Repositories. Akuity uses the same repository credentials as Argo CD when fetching runbook files.
GitOps-managed runbook content is read-only in the UI — edit it in your repository and it will be updated on the next sync. Targeting (applied_to) can be overridden per-runbook directly from the UI without touching the source file. See Configuring Targeting for GitOps Runbooks below.
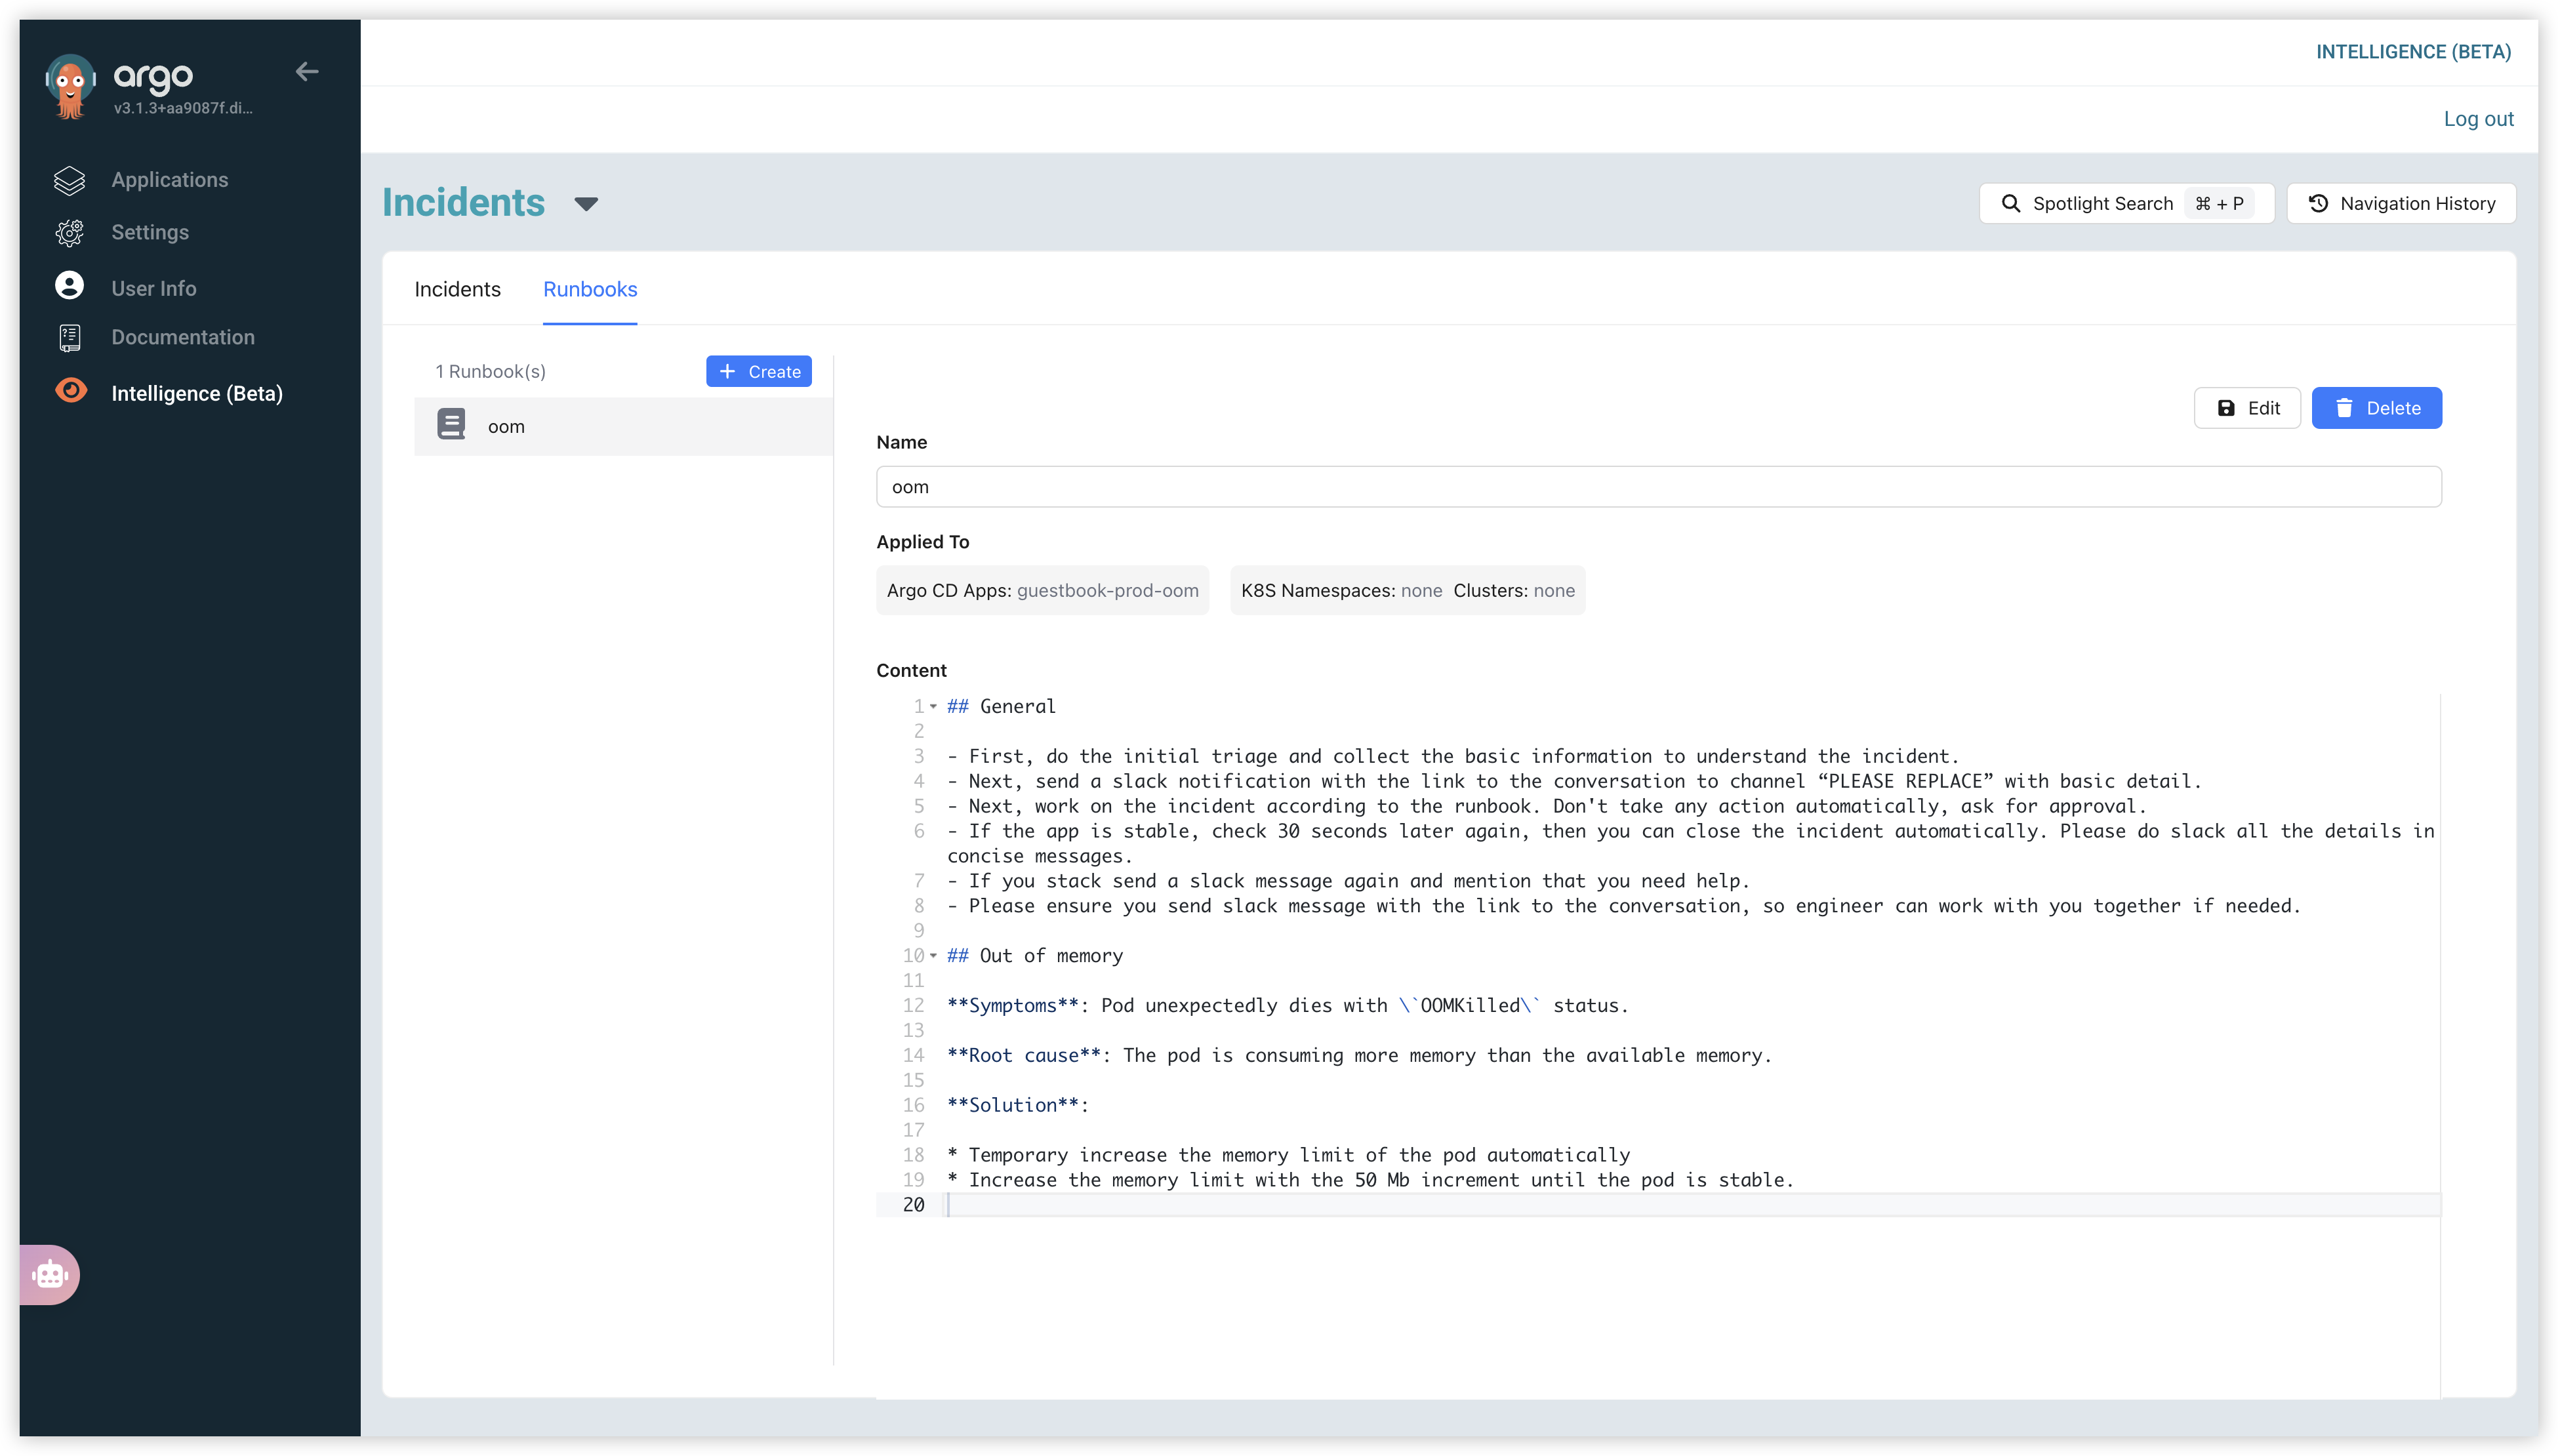
Apply Runbooks to your Resources
After creating a runbook, you must apply it to your Argo CD applications or Kubernetes namespaces. When a linked resource becomes degraded, the On-Call Agent will automatically execute the steps defined in the runbook to resolve the incident.
There are two ways to apply a runbook to your Argo CD applications or Kubernetes namespaces:
- From the Runbook Settings UI. You can directly configure which resources a runbook applies to from the runbook editor.
- Navigate to Intelligence (Beta) in the left-hand sidebar.
- Select the Runbooks tab.
- Click + Create to make a new runbook, or select an existing runbook and click Edit.
- In the Applied To section, specify the Argo CD Apps, K8S Namespaces, or Clusters that this runbook should monitor.
- In the example, the runbook named oom is applied to the Argo CD Application
guestbook-prod-oom.
- Using Kubernetes Annotations. You can also apply a runbook by adding an annotation directly to the manifest of your Argo CD Application or Kubernetes Namespace.
- Add the annotation
akuity.io/runbooks: "<runbook_name>"to the resource's metadata. - For the example shown, you would add the following annotation to the guestbook-prod-oom Application resource:
akuity.io/runbooks: "oom"
- Add the annotation
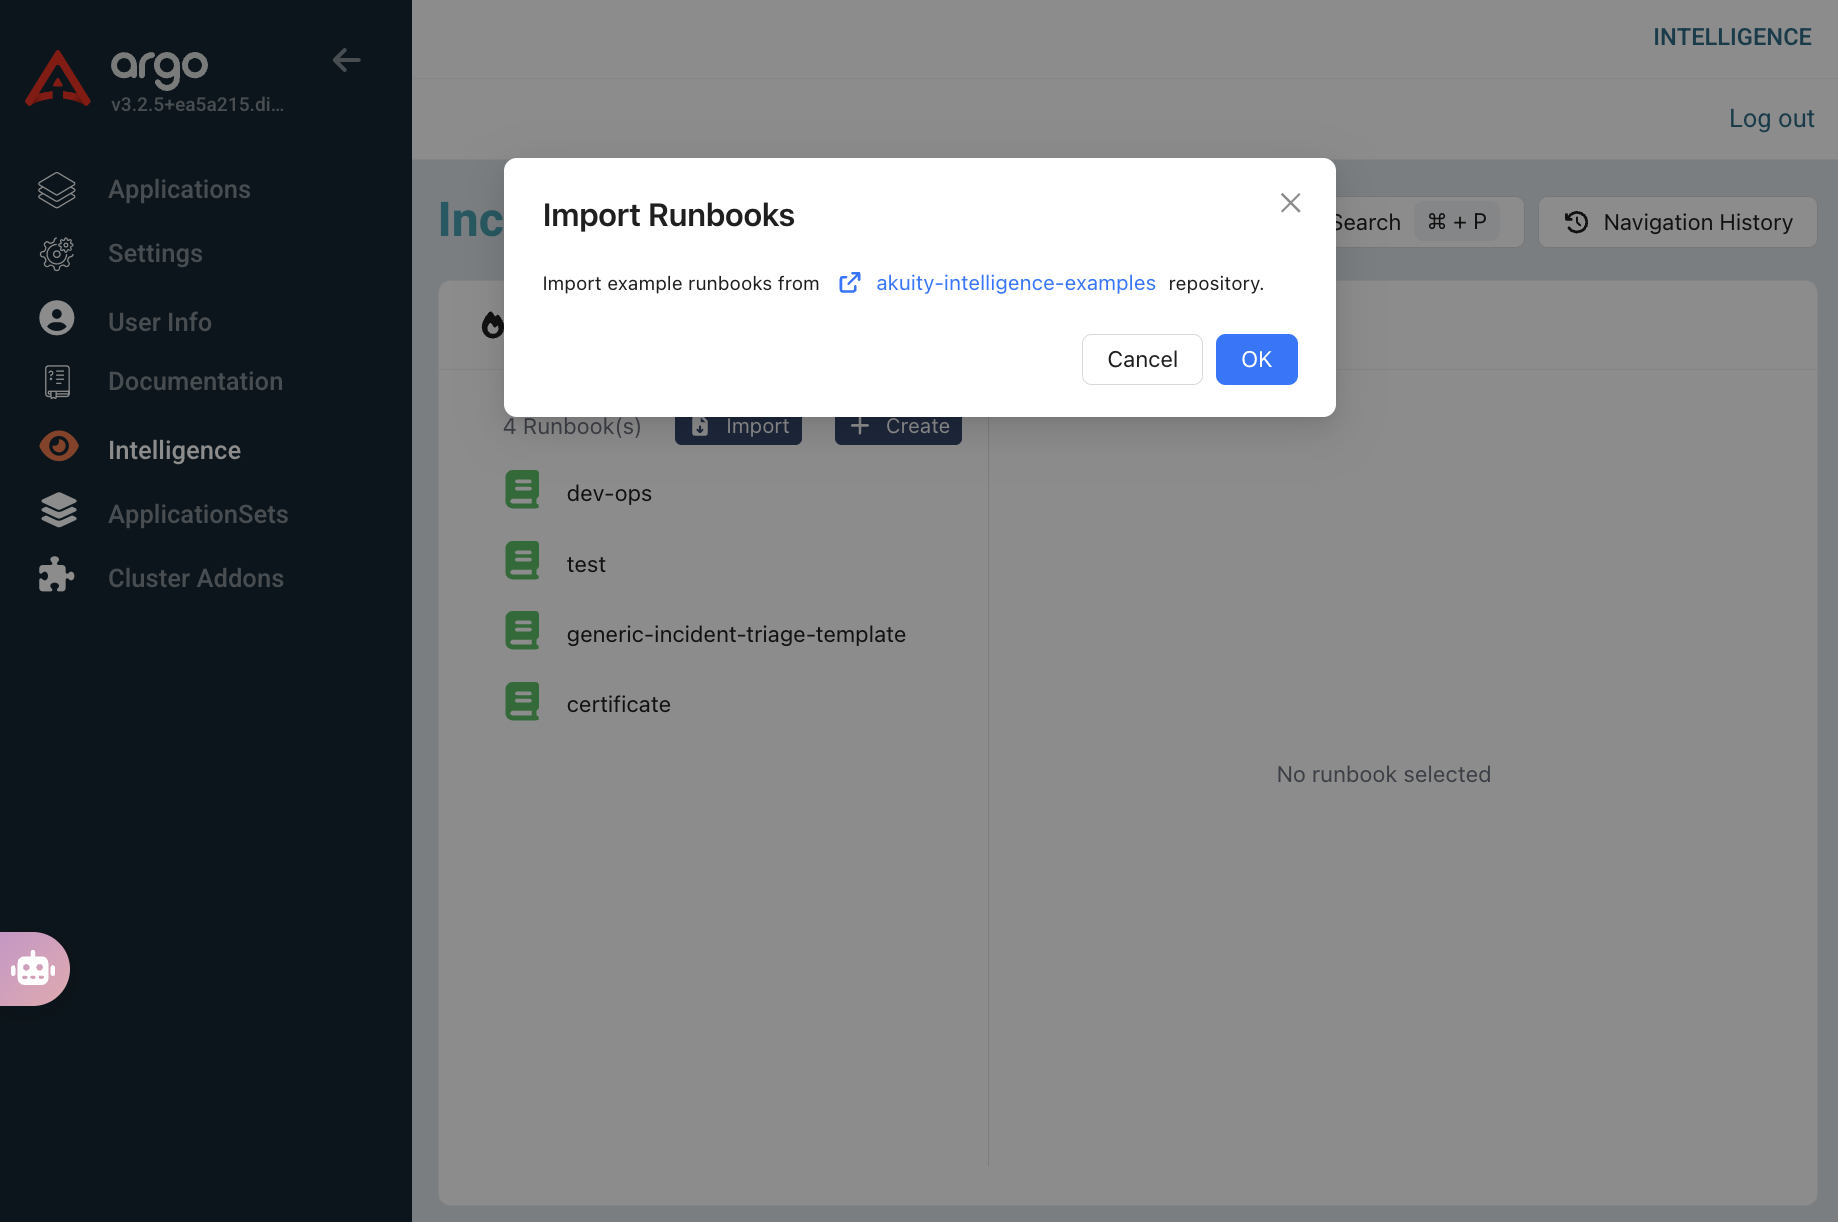
Example Runbooks
We have established some example runbooks in the akuity-intelligence-examples GitHub repository. There are two ways to use them:
- One-time import: Click the Import dropdown and select Import examples to copy the runbooks into your instance. You can then edit them freely in the UI.
- GitOps sync: Click the Import dropdown and select Connect Git repo, then add
https://github.com/akuity/akuity-intelligence-examples. Runbooks will stay in sync with the repository automatically.
Note: After importing, the runbook will not be enabled by default. You need to add the corresponding Applied To configuration to enable the runbook.
Managing Incidents
When an Argo CD application or Kubernetes namespace becomes degraded, the On-Call Agent will automatically create an incident. You can view and manage these incidents from the Incidents dashboard. The Incidents tab will display a list of all incidents. You can filter this list by Status (e.g., Unresolved, All), Application, or Namespace.
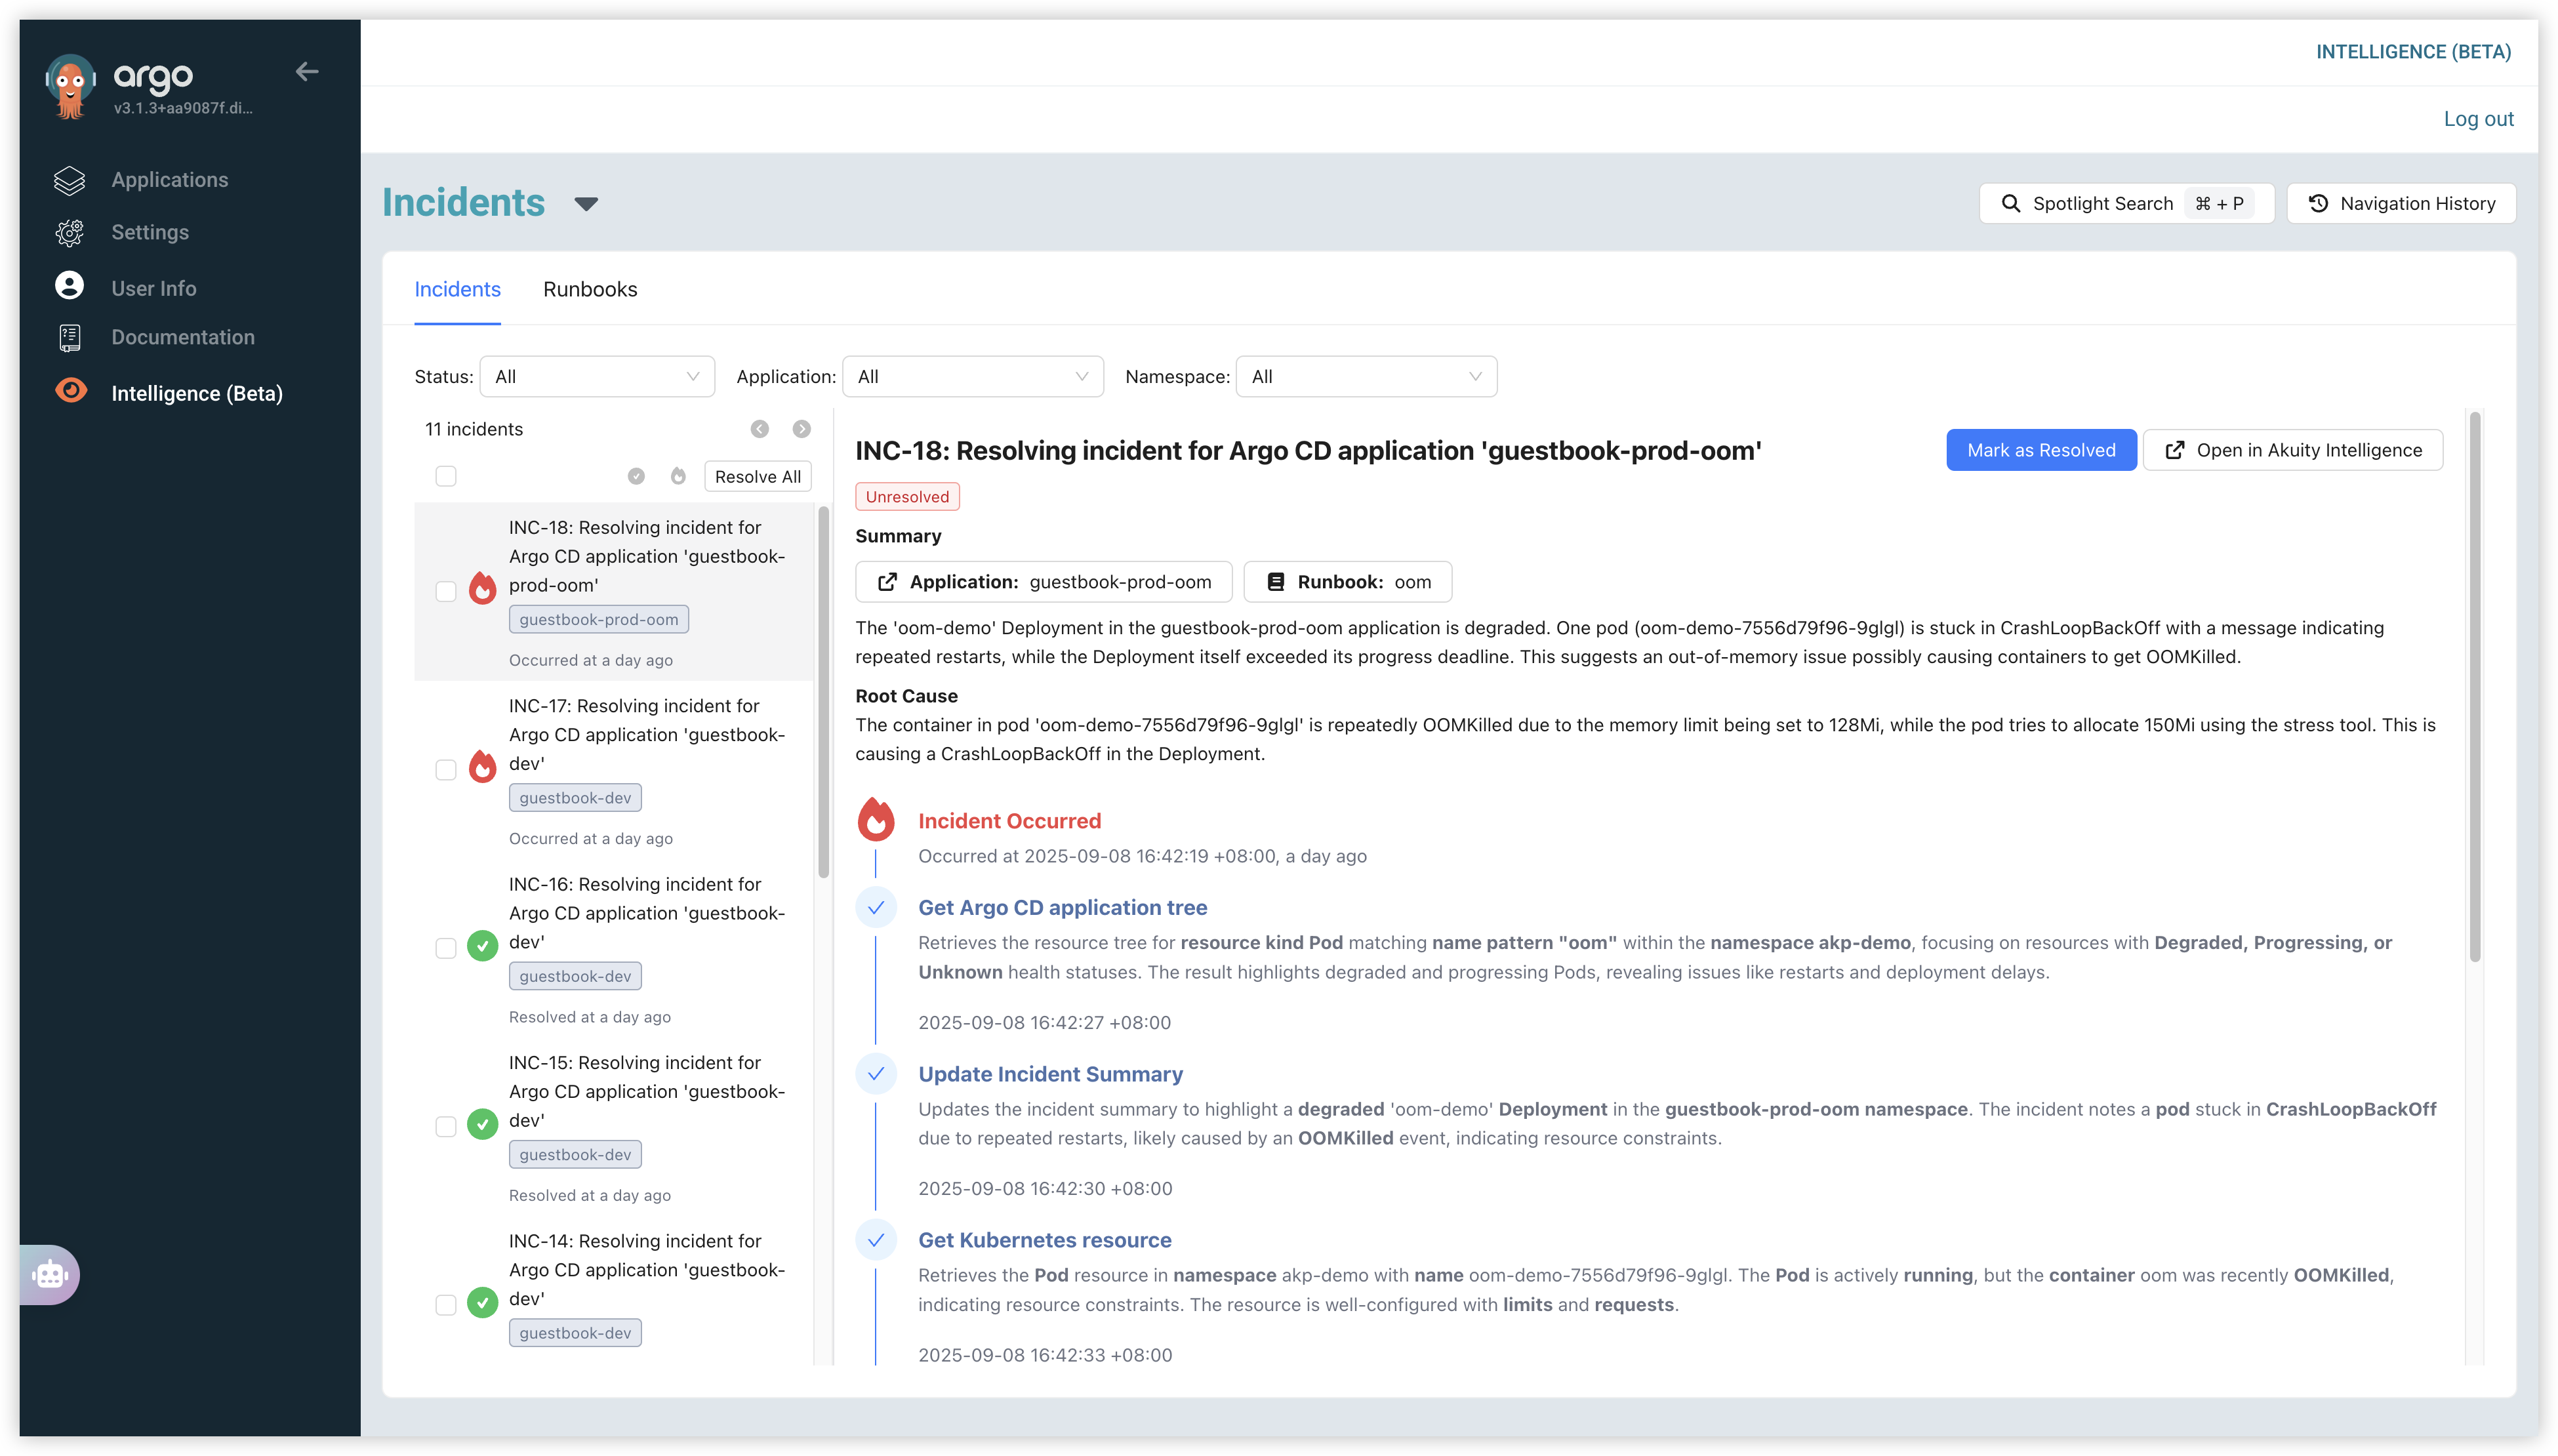
Click on an incident from the list to view its details. This view provides a live, step-by-step account of the troubleshooting process:
- Summary: A high-level overview of the issue, including the affected application and the runbook being used.
- Root Cause: An analysis of the likely cause of the incident (e.g., an OOMKilled event due to memory limits).
- Live Troubleshooting Log: A timeline showing every action taken by the intelligence agent, from initial detection ("Incident Occurred") to diagnostic steps like fetching the application tree and inspecting Kubernetes resources.
The On-Call Agent will attempt to resolve the incident automatically using the applied runbook.
- If the incident is successfully resolved, its status will be updated to Resolved.
- If the issue persists, the incident will remain Unresolved. You can then take manual action:
- Mark as Resolved: If you have fixed the issue outside of the system, you can manually close the incident.
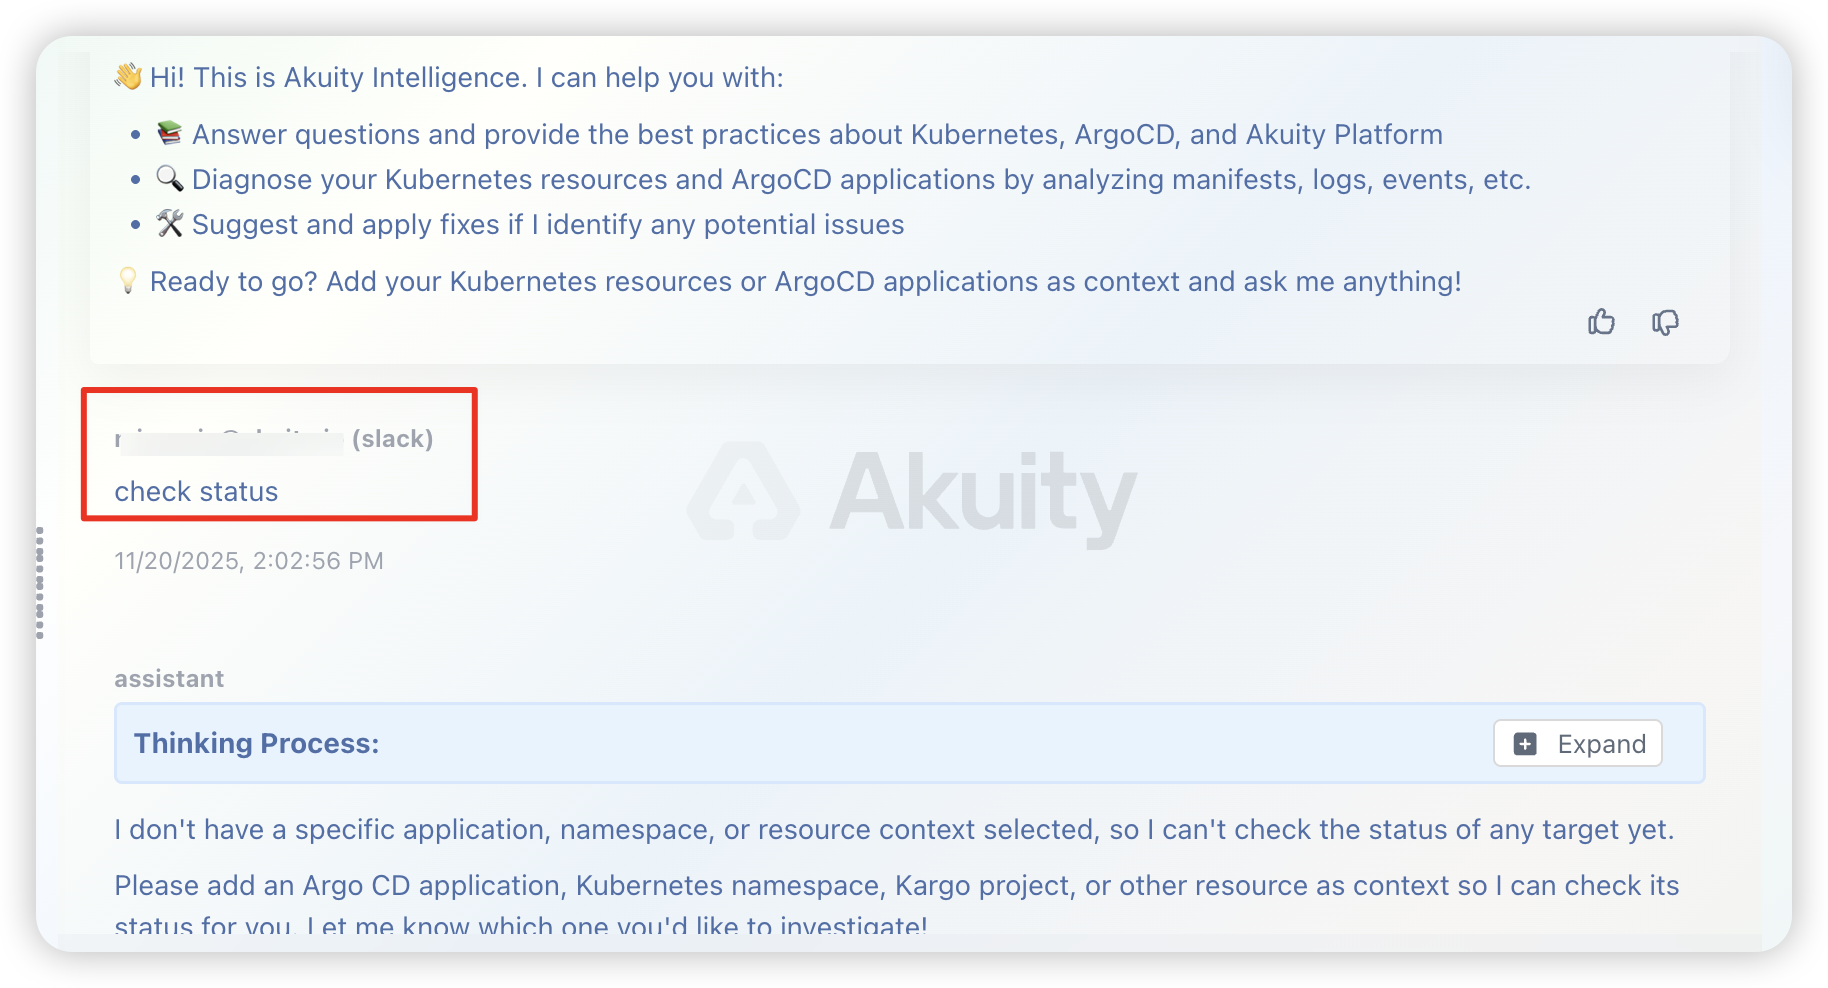
- Open in Akuity Intelligence: Click this button to open the incident in the chat interface. Here, you can work directly with the On-Call Agent, provide more instructions, or ask it to "resolve it" to continue the troubleshooting process interactively.
Slack Integration
Akuity Intelligence can notify Slack about incidents and, if you enable the full Slack Integration, keep conversations in sync. Use the configuration level that matches what you need:
- Send incident updates to Slack using Argo CD notifications, this is single directional conversation sync. it sends alerts to Slack from Akuity Intelligence.
- Add bi-directional conversation sync, Share to Slack, and thread-first workflows. This layer builds on the alerting setup and requires additional Slack app permissions.
Configure the Slack Service
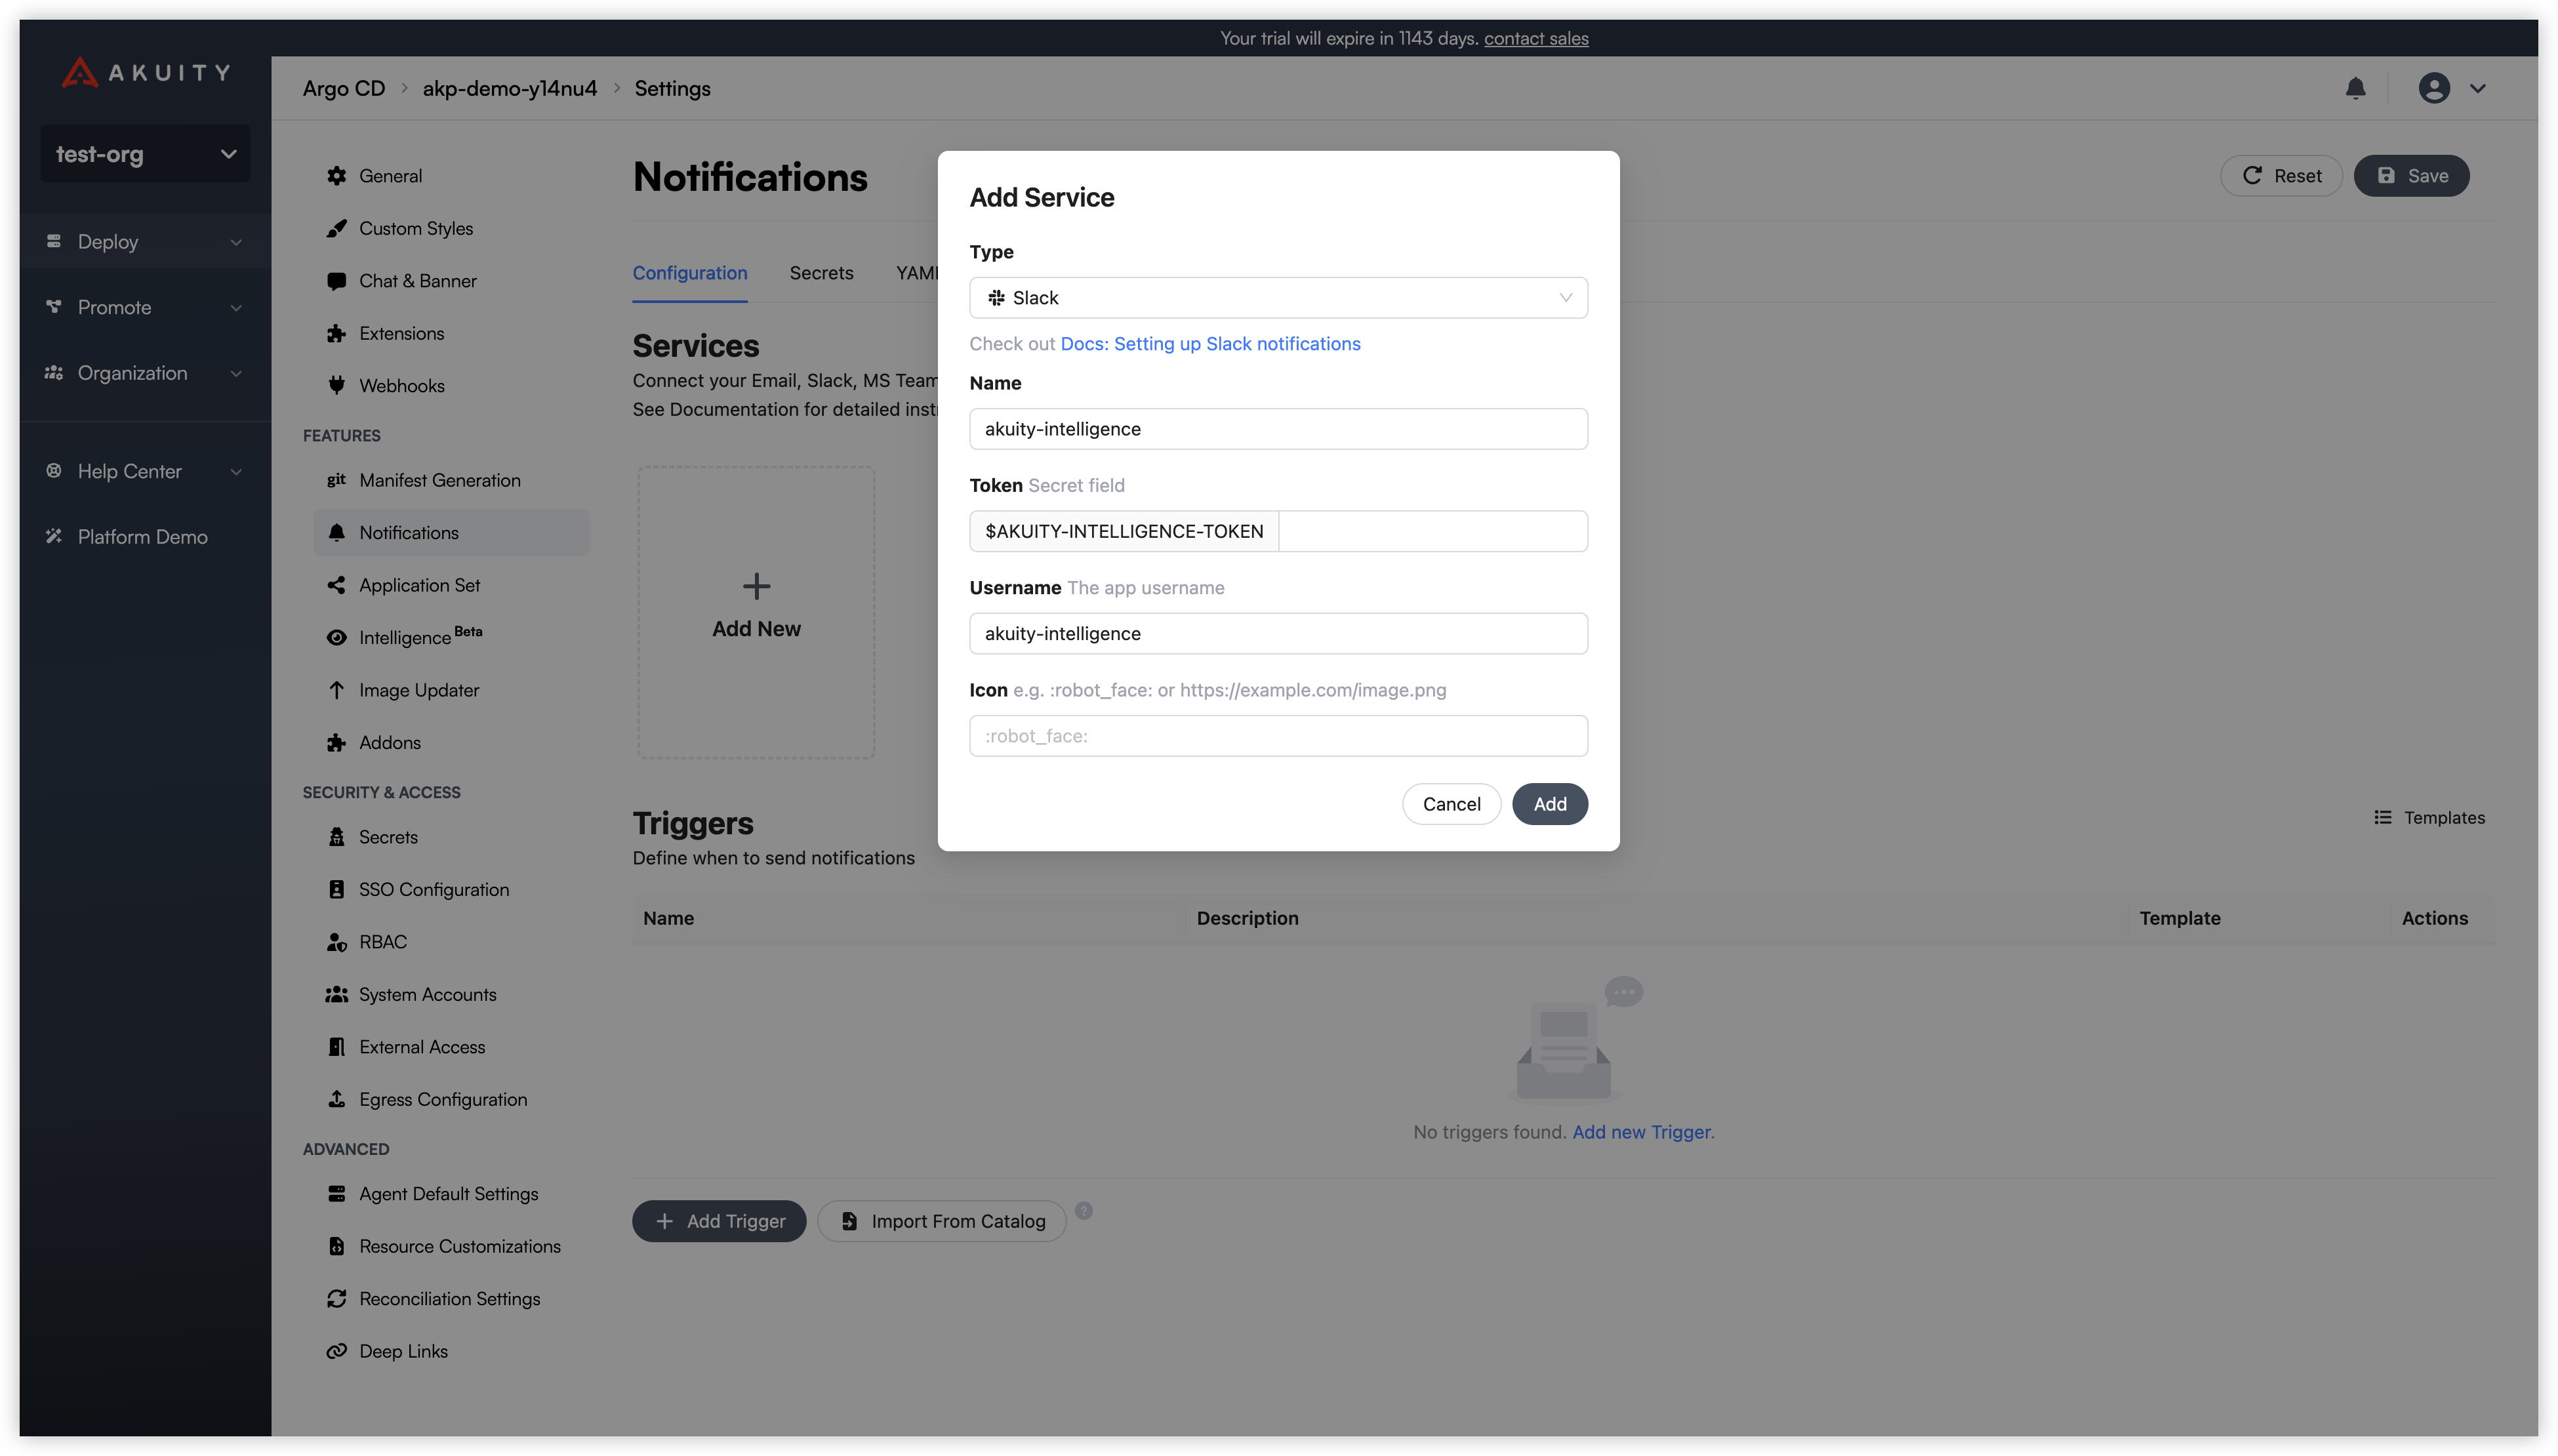
Both experiences rely on an Argo CD Slack service. Create or update it under Settings → Notifications → Services:
- Click Add New → Slack (or edit an existing service).
- Provide a Name (e.g.,
slack-main). - Enter your Slack Bot Token (
xoxb-…). This is required for incident notifications. - (Slack Integration only) Enter your App-Level Token (
xapp-…) so Socket Mode can power live conversation sync. - Optionally set a posting Username and Icon.
- Save the service.
If you rotate either token later, update the Slack service to avoid delivery failures.
Link Slack to Akuity Intelligence
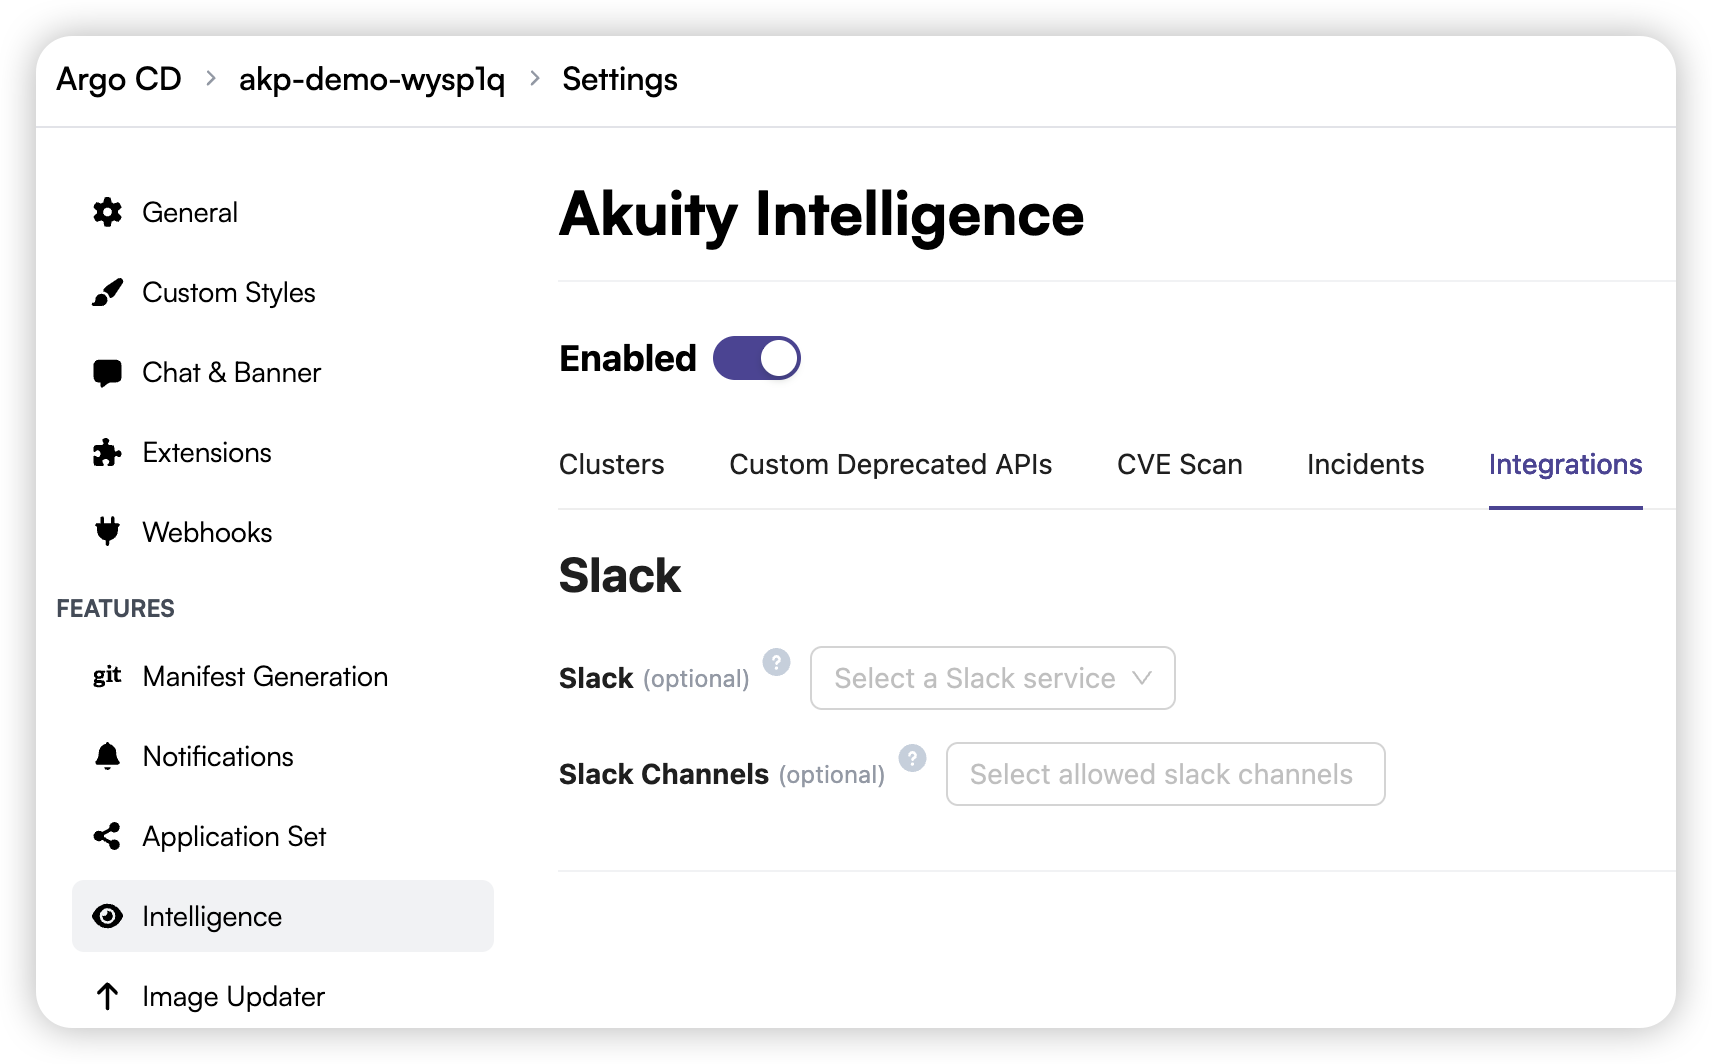
After the Slack service exists, connect it to Intelligence so incident updates flow to Slack:
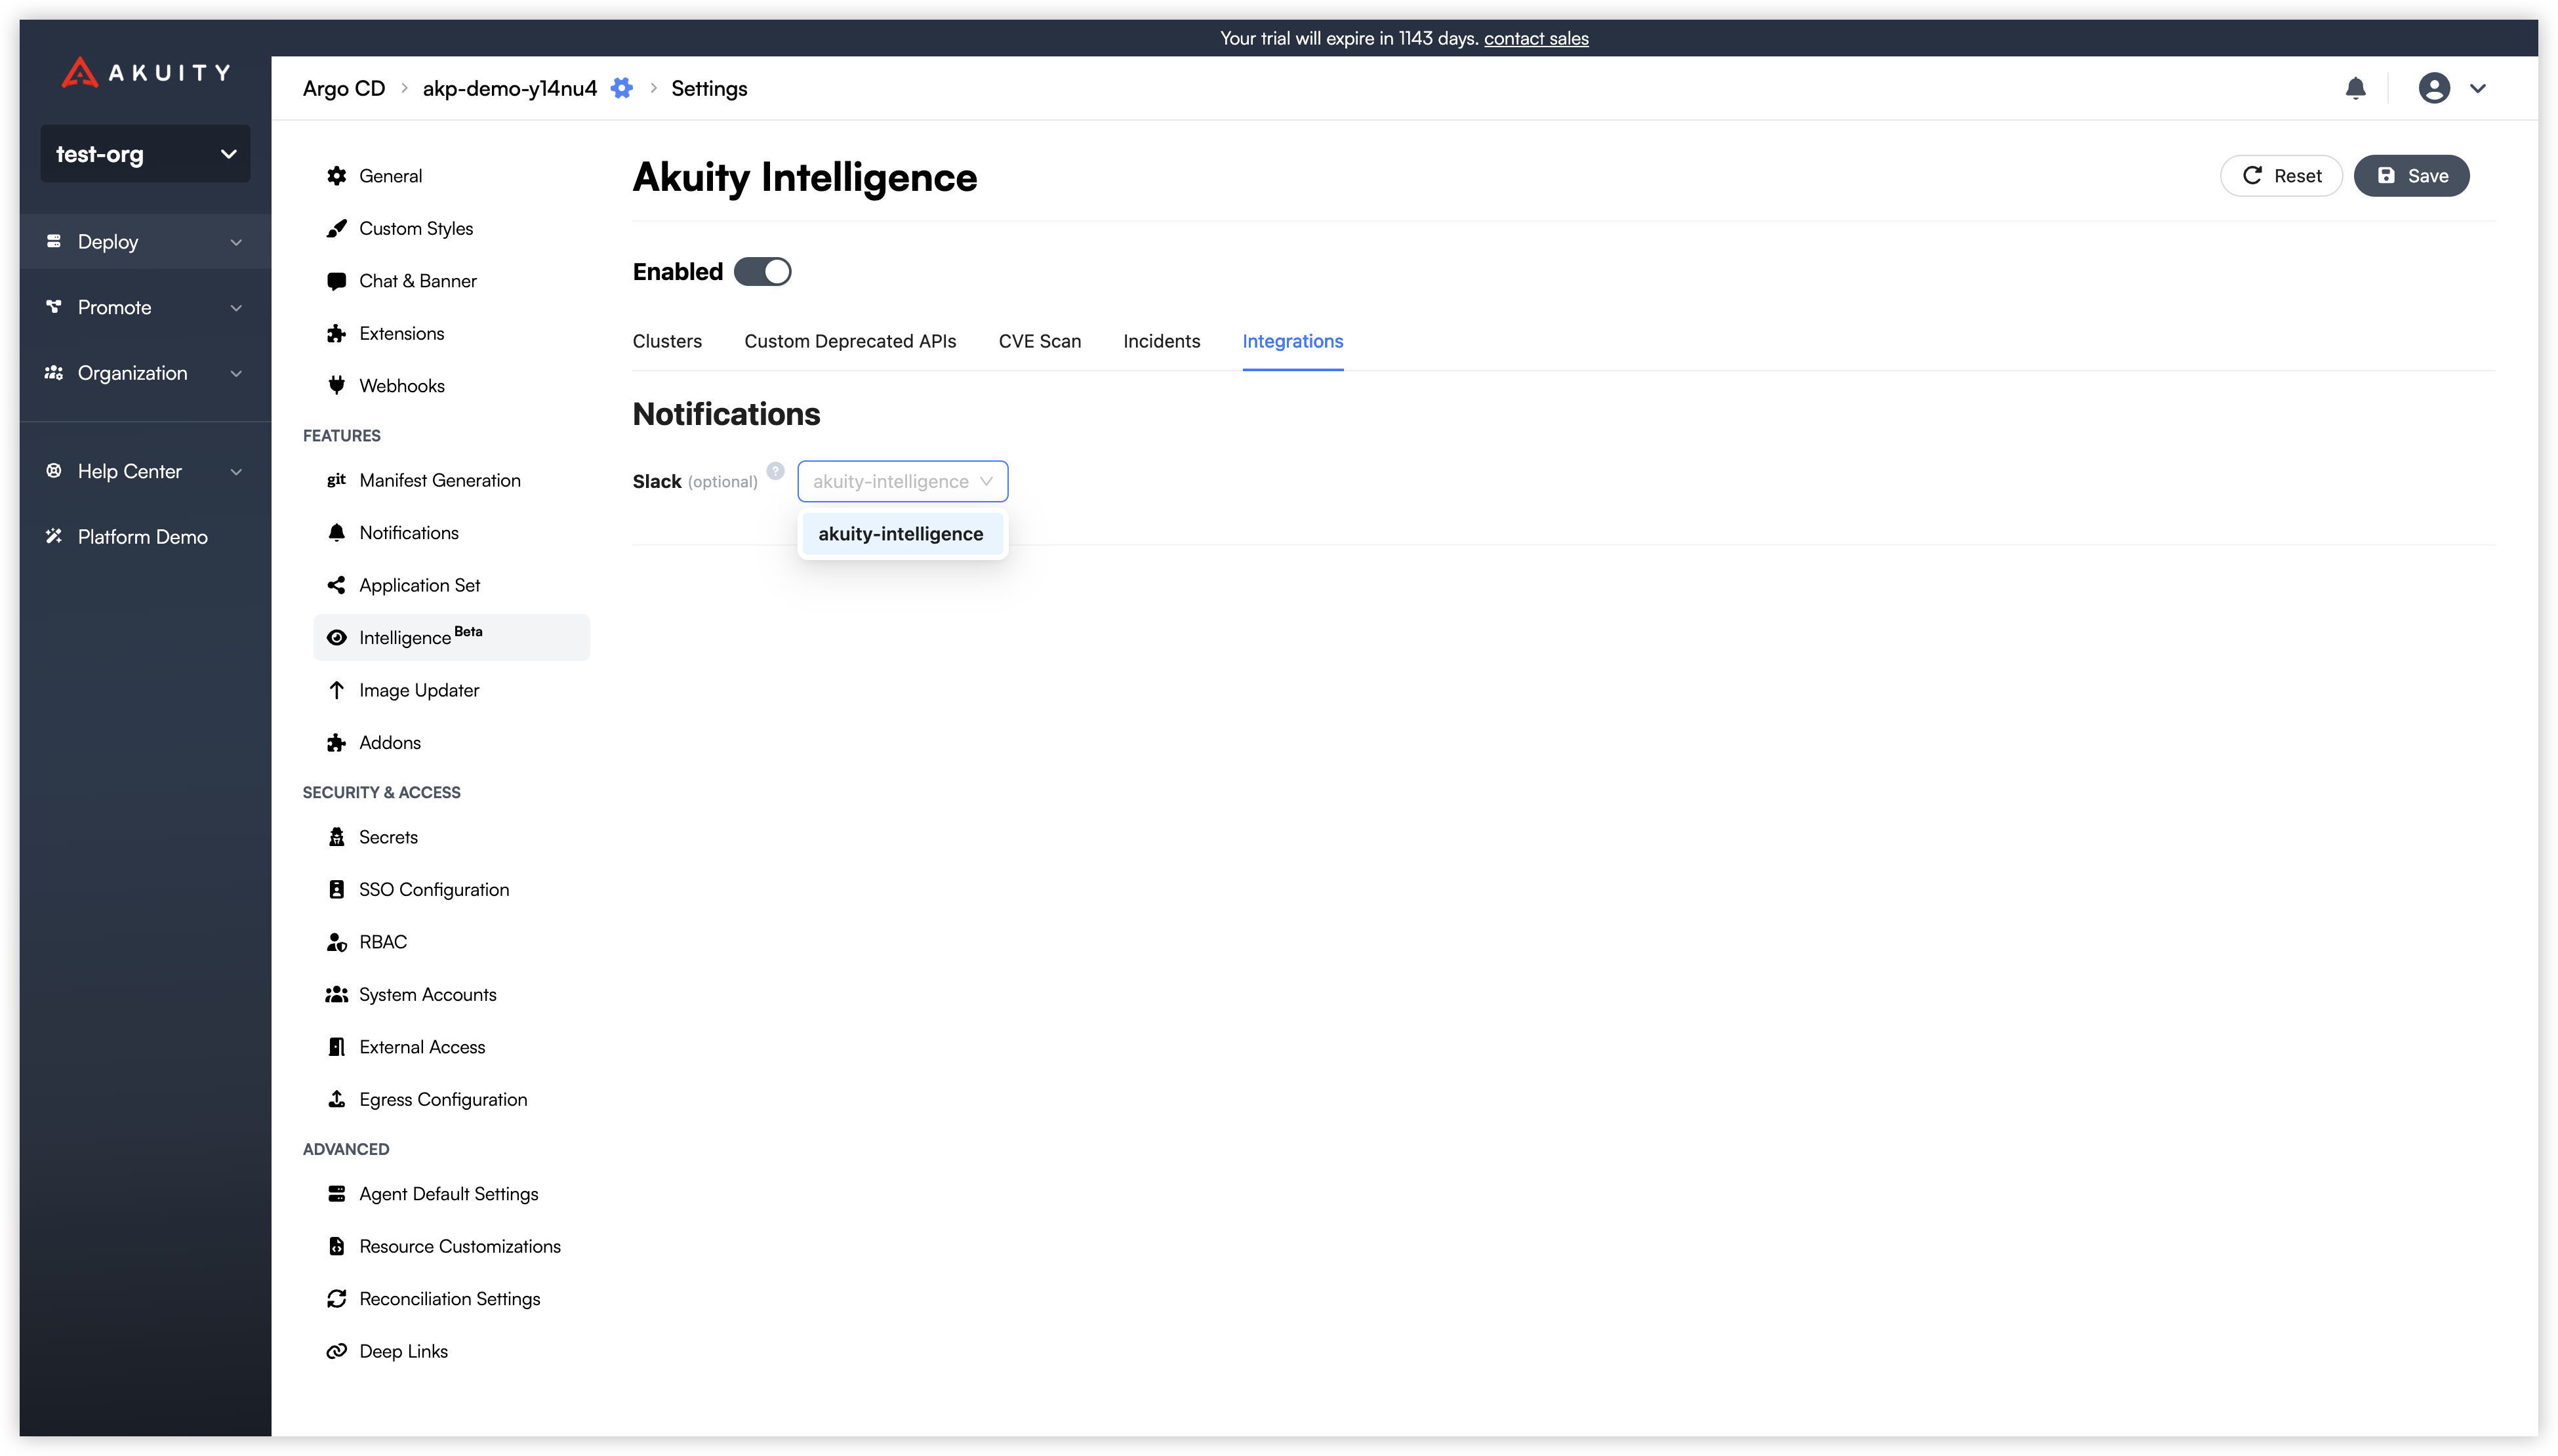
- Click on the Integrations tab.
- In the Notifications section, locate the Slack option.
- Click the dropdown menu and select the Slack service you configured in the previous step.
- Click Save in the top-right corner to apply the changes.
With this in place, the On-Call Agent posts new and ongoing incident activity to the channels configured for that Slack service.
Additional Setup for Slack Integration
If you plan to collaborate directly from Slack threads, configure your Slack app with the permissions and subscriptions below. These steps unlock Share to Slack, bi-directional chat, and conversation sync without changing how the On-Call Agent posts incident alerts.
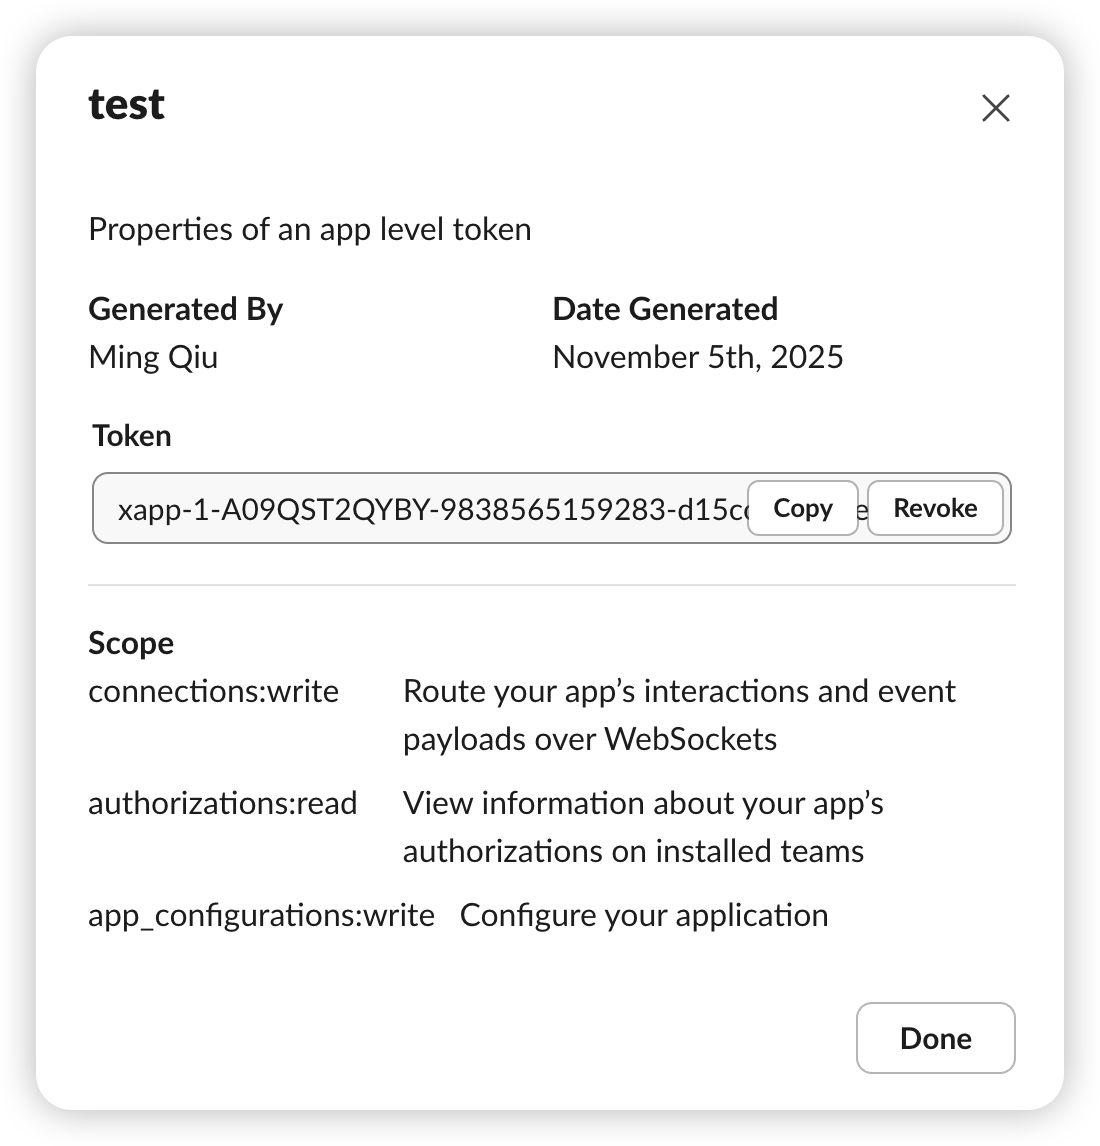
Generate an App-Level Token
App-level tokens let Akuity connect to Slack platform features such as Socket Mode.
- Navigate to Settings → Basic Information → App-Level Tokens.
- Click Generate an app-level token.
- Add the scopes:
connections:write,authorizations:read, andapp_configurations:write.
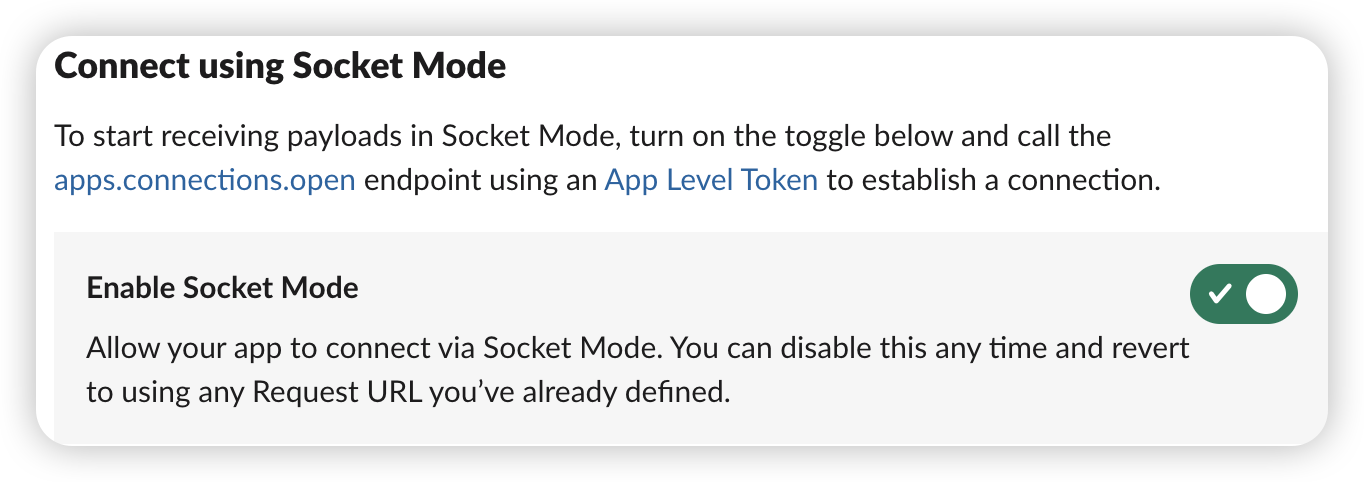
Enable Socket Mode
Socket Mode keeps Slack traffic behind WebSockets so you do not need to expose a public endpoint.
- Open Settings → Socket Mode.
- Turn on Connect using Socket Mode.
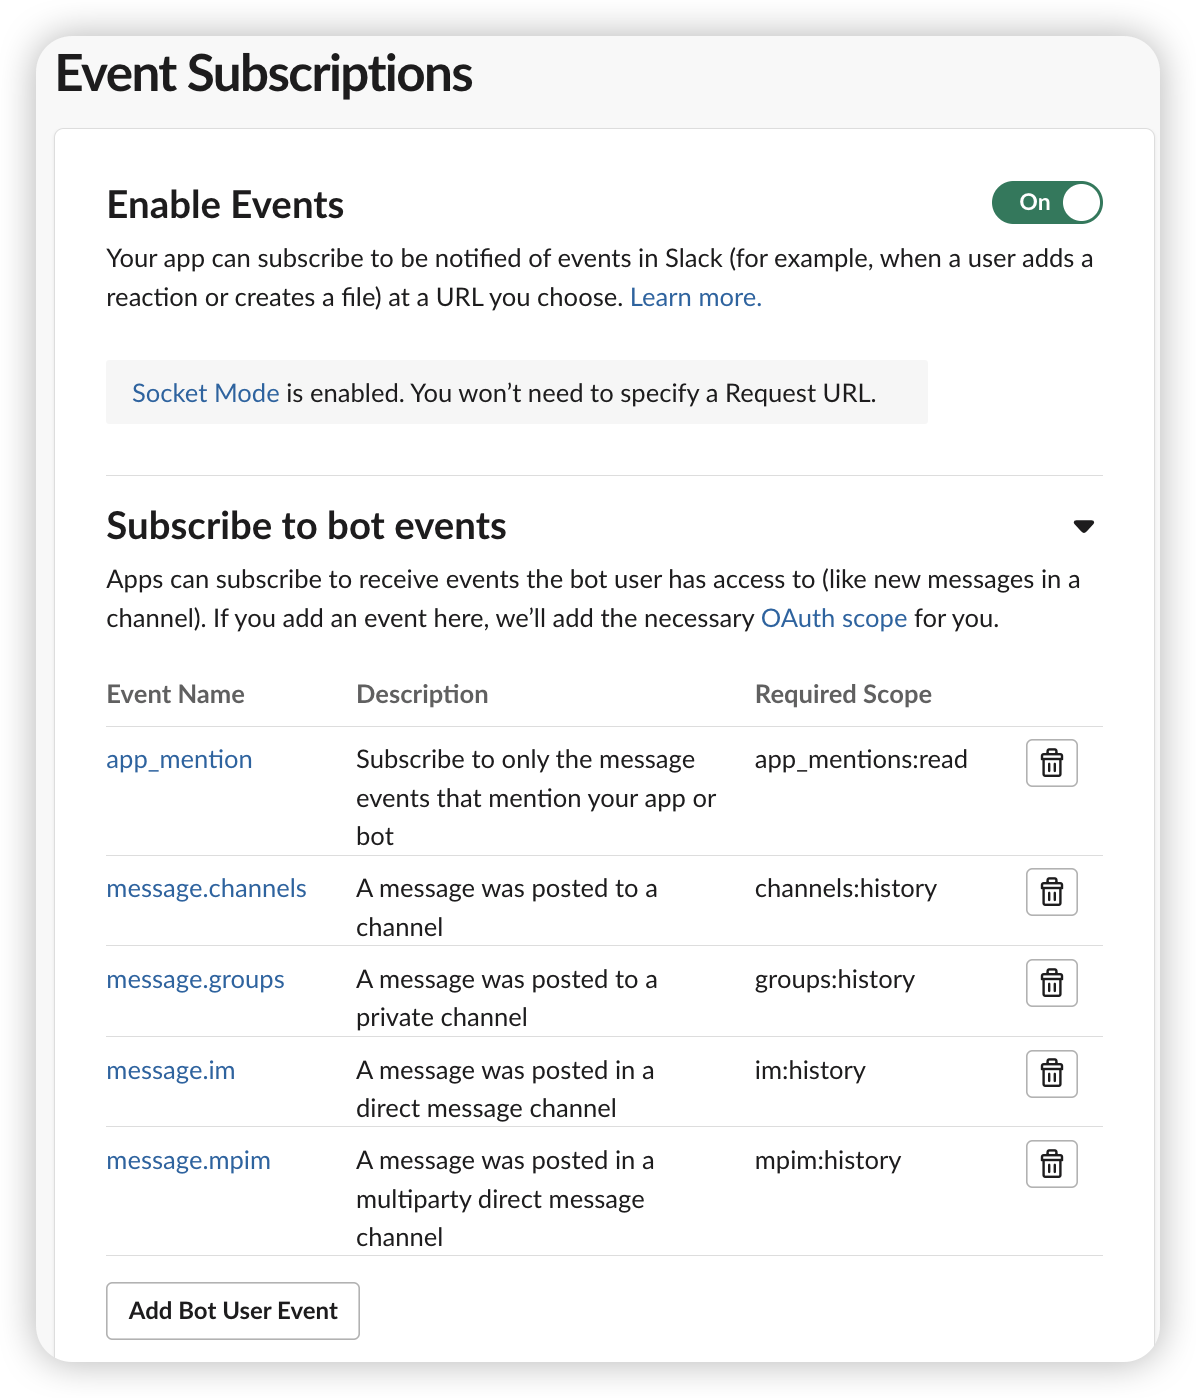
Configure Event Subscriptions
Event subscriptions allow Akuity to receive messages and mentions from the channels you monitor.
- Go to Features → Event Subscriptions.
- Enable Events.
- Under Subscribe to Bot Events, add:
app_mention,message.channels,message.groups,message.im, andmessage.mpim.
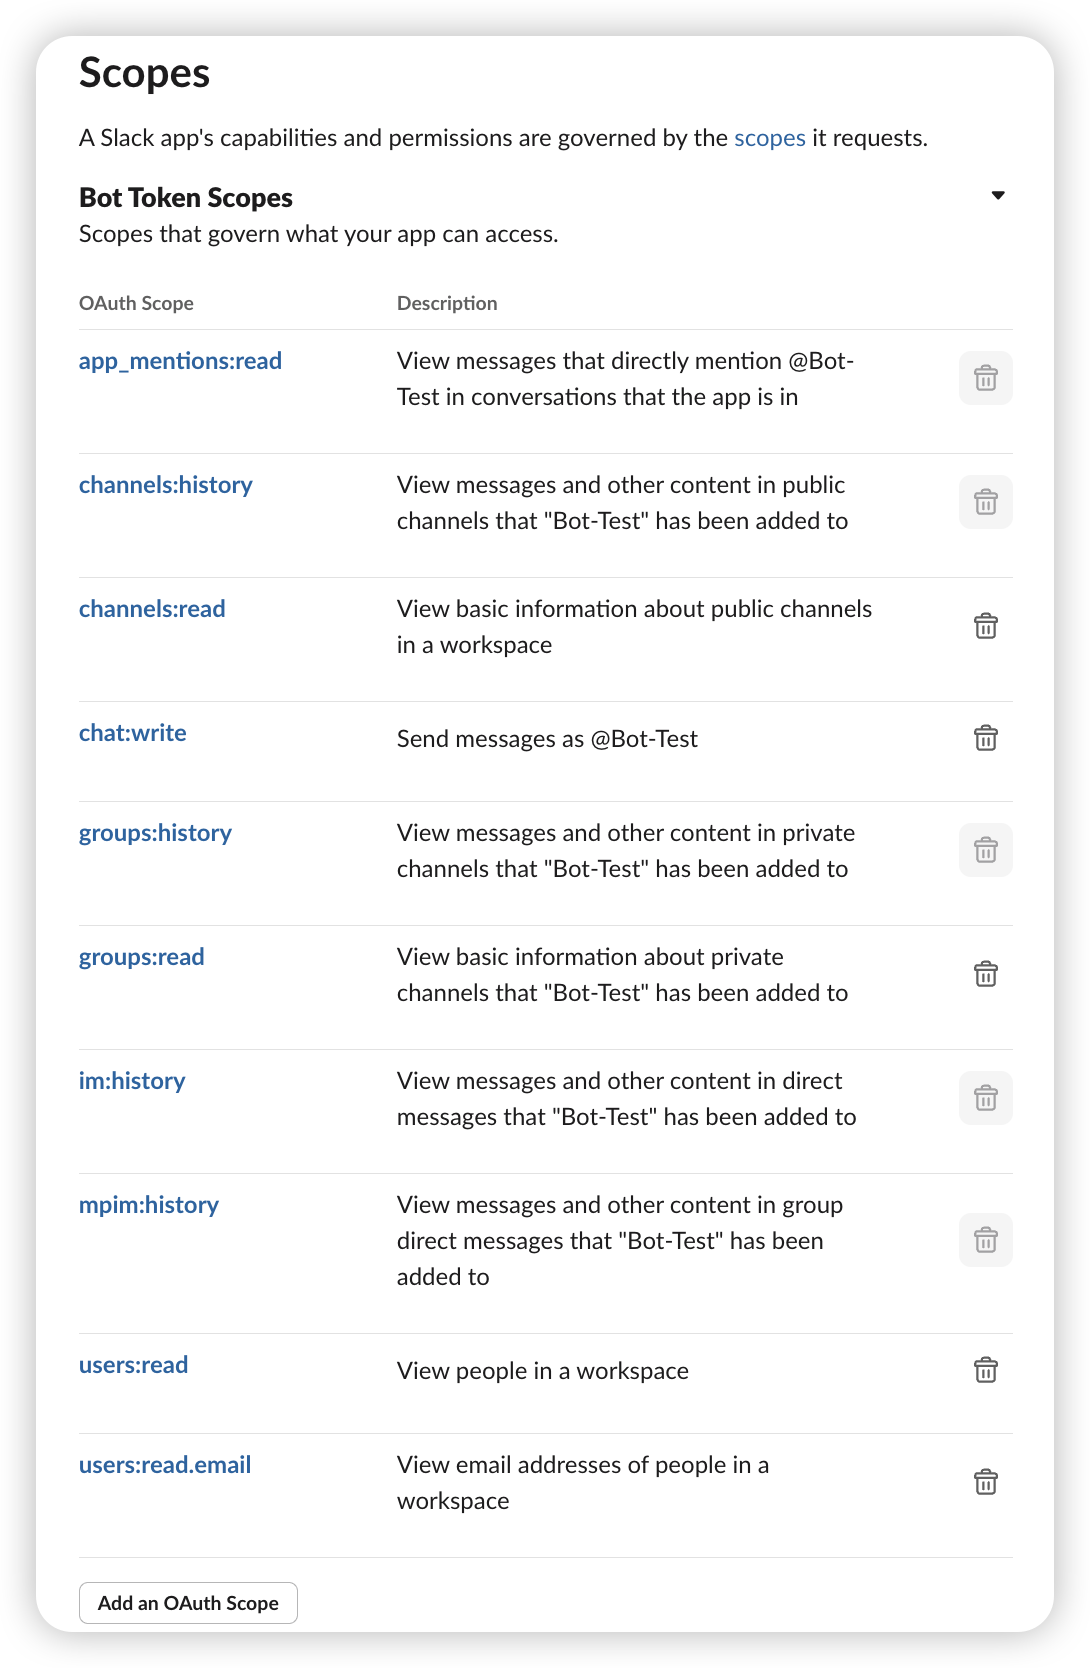
Configure OAuth & Permissions
Bot token scopes define what your Slack app can read and write when syncing conversations.
- Open Features → OAuth & Permissions.
- Under Scopes, add:
app_mentions:read,channels:history,channels:read,chat:write,groups:history,groups:read,im:history,mpim:history,users:read, andusers:read.email.
Allowlist Slack Channels for Share to Slack
- Return to the target Argo CD instance and open Settings → Intelligence → Integrations.
- With your Slack service selected, find Slack Channels.
- List the channels (without
#) that should appear in the Share to Slack dialog. This acts as an allowlist. - Save the settings and invite the Slack app (bot user) to each listed channel so first posts succeed.
When these optional steps are complete, the Slack Integration experience—thread sync, share-to-Slack workflows, and responding to incidents inside Slack—is available alongside the standard On-Call Agent notifications.
Using Slack Integration
Once configuration is complete, you can share conversations to Slack, collaborate inside threads, and review synced incidents without leaving Slack.
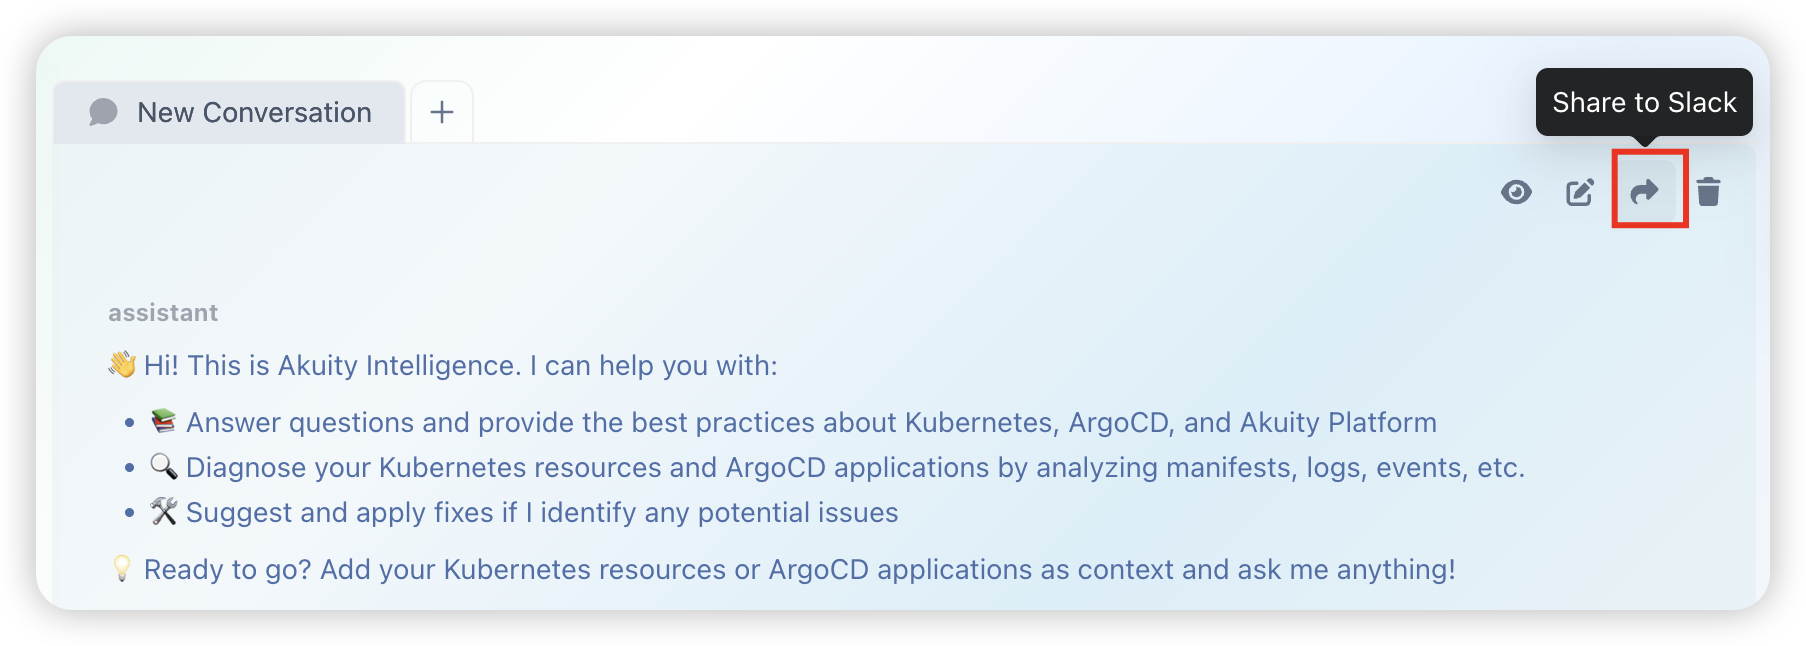
Sharing Conversations to Slack
After services and channels are configured, conversation owners can use the Share to Slack action in the AI Conversation UI:
- Open a conversation and click Share to Slack. The modal lists the allowlisted channels you configured earlier.
- Pick a destination. If the conversation is already shared, the modal shows the existing permalink and an Unshare option.
- Confirm Share. The backend will make the conversation public if it was private, capture the title, generate a permalink, and post to the selected Slack channel with both pieces of context.
Re-sharing to the same channel refreshes the thread and permalink. Unsharing clears the stored Slack metadata and returns the conversation to private visibility.
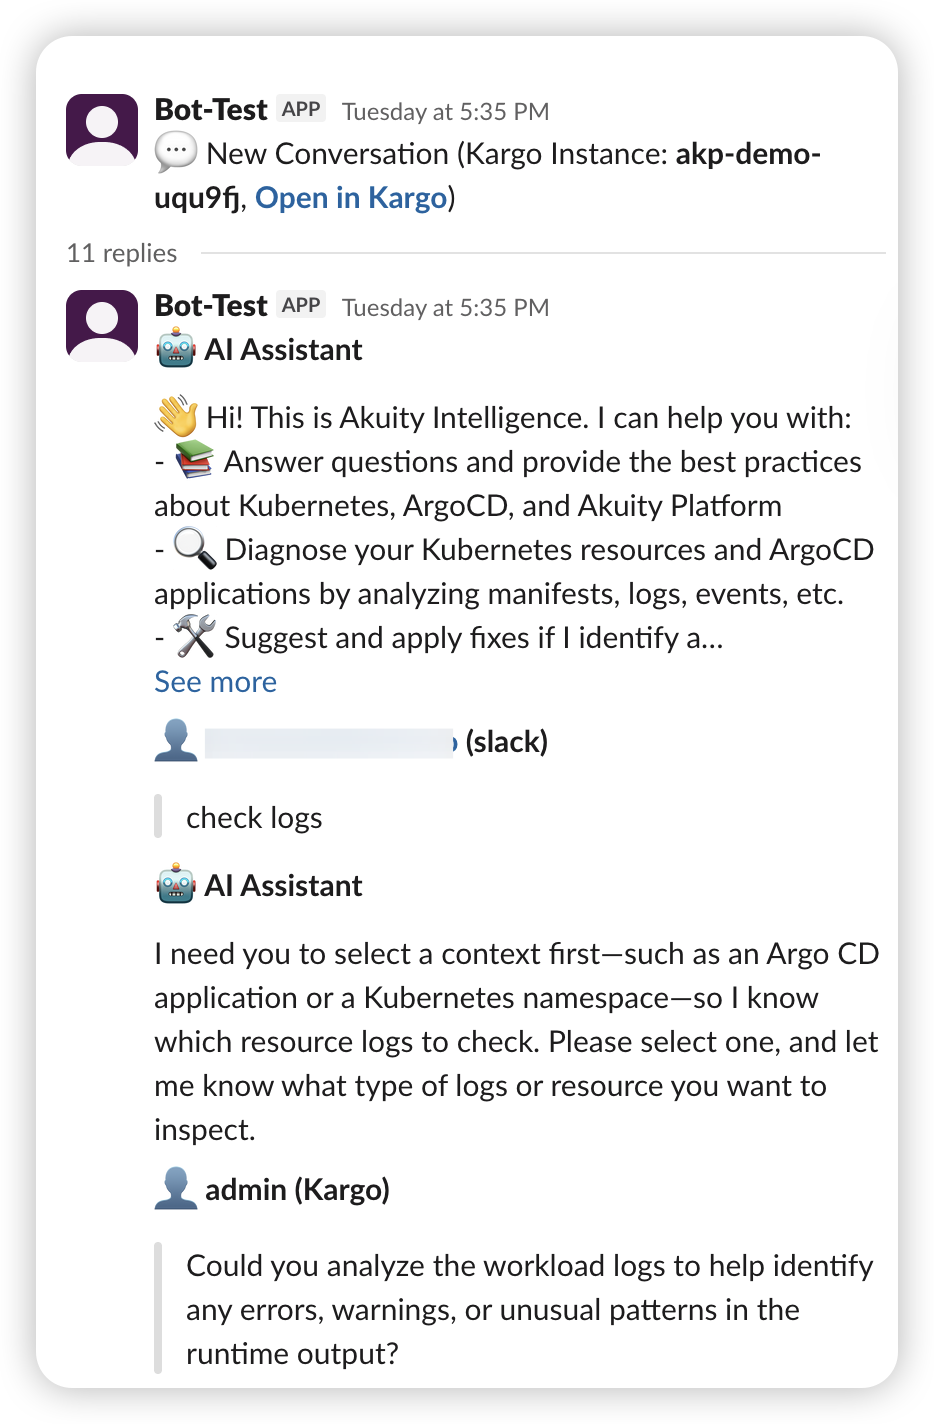
Interacting in Slack
-
Outbound (AKP → Slack): New messages in the AI conversation automatically post to the Slack thread.
-
Inbound (Slack ��→ AKP): When a human replies in the linked Slack thread or mentions the bot, the message syncs back to the AKP conversation.
Automatic Incident Synchronization
Akuity Intelligence can detect incidents (for example, degraded applications) and notify your team via Slack. The automation is driven by the runbooks attached to your resources.
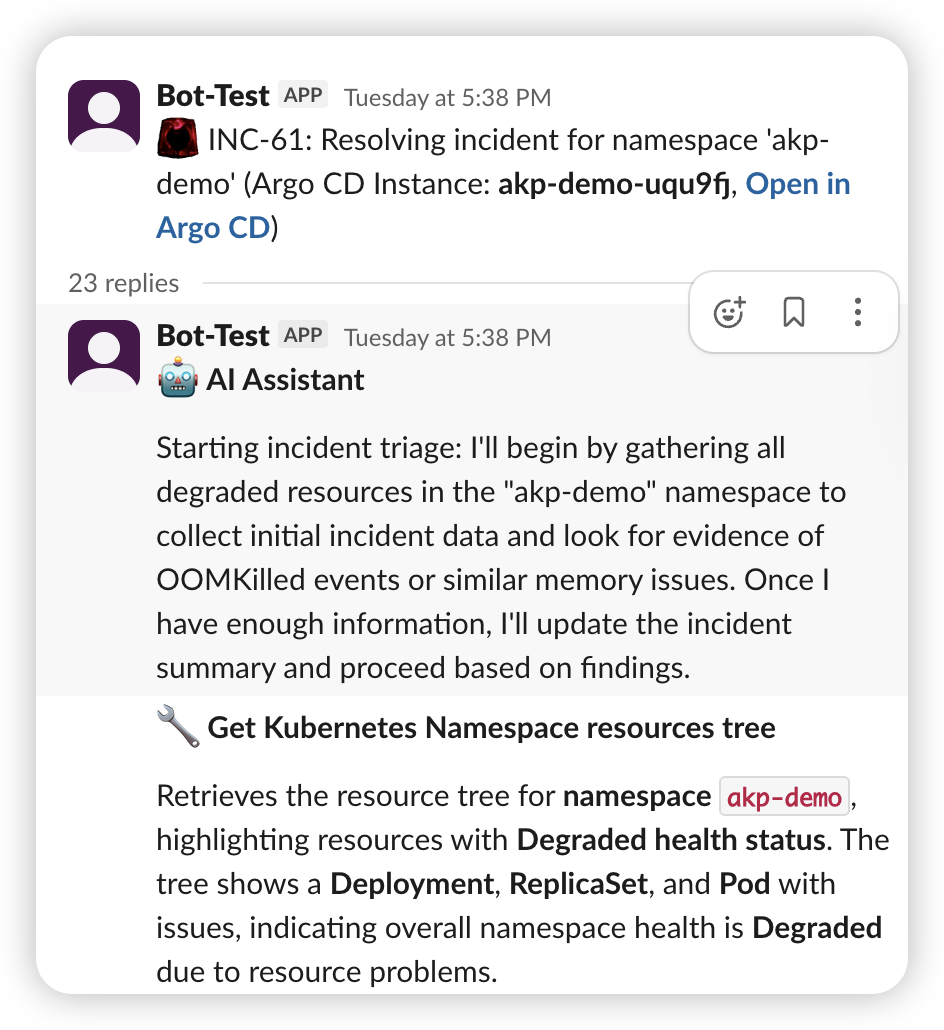
Interacting with Incidents in Slack
- View Details: Incident messages include a summary, ID (for example,
INC-123), and a link back to the AKP console. - Reply in Thread: Collaborate directly in the Slack thread.
- AI Response: The AI monitors the thread and responds to questions or commands (for example, “Get the logs for the test-service pod”).
- Two-Way Sync: Every message in the Slack thread is mirrored in the incident conversation inside the AKP console.
The AI only posts to channels you explicitly allow in Slack Channel Configuration. Ensure your runbook references one of those channels.
Troubleshooting
If Slack synchronization is not working as expected, verify the following:
- Permissions: Confirm the Slack app includes the
channels:read,chat:write, andgroups:readscopes. - Tokens: In Settings → Notifications, ensure both Slack tokens are valid.
- Channel Membership: Invite the Slack app (bot) to the target channel (
/invite @YourApp). - Socket Mode: When using Socket Mode, confirm the app-level token is configured and Socket Mode is enabled.
- Runbook Instructions: For incident sync, make sure your runbook tells the AI to post to Slack and names the correct channel.
- Service not listed: Verify the Slack service you created under Notifications starts with
service.slack.and save the Intelligence settings again. - Share fails immediately: The bot may lack access to the channel or tokens may be stale. Reinvite the bot, rotate the secrets, and click Save in Notifications.
- Slack replies do not sync: Check platform logs for socket pool warnings. If the instance was unregistered, confirm both bot and app tokens resolve correctly from the secret.
Interacting in Git
Akuity Intelligence can read from and write to the Git repositories backing your Argo CD applications. It uses the Git credentials already configured for each application's repository in Argo CD — no additional credential setup is required.
Reading Git Content
You can ask the On-Call Agent to inspect repository content as part of troubleshooting or investigation. For example:
- Retrieve the current value of a field in a manifest
- Compare configuration between environments
- Understand how manifests are structured or generated (plain YAML, Helm, Kustomize)
Making Git Changes
The On-Call Agent can make changes directly to the application repository. You can instruct it to commit to an existing branch or to create a new branch for review.
Committing directly to the main branch is appropriate for immediate fixes where no review cycle is needed. For example:
"Update the memory limit for the payment service to 512Mi and commit to main."
Creating a new branch keeps the change isolated and ready for a Pull Request. The agent will suggest a meaningful branch name, commit the change, and prepare a Pull Request with a descriptive title and summary. For example:
"Create a PR that updates the image tag for the frontend deployment to v3.1.1."
Akuity Intelligence will scan the repository, determine how manifests are generated, locate the correct file, and apply the change — whether the application uses plain YAML, Helm values files, or Kustomize overlays. You do not need to specify which file to modify.
Customizing Git Behavior
You can define preferences for how the On-Call Agent interacts with Git by describing them in a runbook. For example, you can specify:
- Whether changes should go to a new branch or directly to main
- Preferred branch naming conventions
- Required PR labels or reviewers
- Whether to require human approval before pushing any change
Git write operations use the same repository credentials configured in Argo CD for the application. Ensure those credentials have write access to the repository if you intend to use the On-Call Agent for Git changes.