Prometheus Operator
ServiceMonitors
The Prometheus Operator supports the use of ServiceMonitor resources to scrape metrics from Argo CD components.
Deployment of the Prometheus Operator and corresponding ServiceMonitor resources to each managed cluster is the responsibility of the cluster administrator and is considered out of scope for this document.
Below is an example configuration for scraping metrics from both the argocd-repo-server and argocd-application-controller for a single managed cluster:
The metadata.namespace field must match the namespace where the Akuity Agent is deployed (default: akuity).
The metadata.labels.release should align with a label defined in the Prometheus Operator's serviceMonitorSelector, particularly when using kube-prometheus-stack.
apiVersion: monitoring.coreos.com/v1
kind: ServiceMonitor
metadata:
  name: argocd-repo-server-metrics
  namespace: akuity
  labels:
    release: kube-prometheus-stack
spec:
  selector:
    matchLabels:
      app.kubernetes.io/name: argocd-repo-server
  endpoints:
  - port: metrics
    interval: 30s
---
apiVersion: monitoring.coreos.com/v1
kind: ServiceMonitor
metadata:
  name: argocd-application-controller-metrics
  namespace: akuity
  labels:
    release: kube-prometheus-stack
spec:
  selector:
    matchLabels:
      app.kubernetes.io/name: argocd-metrics
  endpoints:
  - port: metrics
    interval: 30s
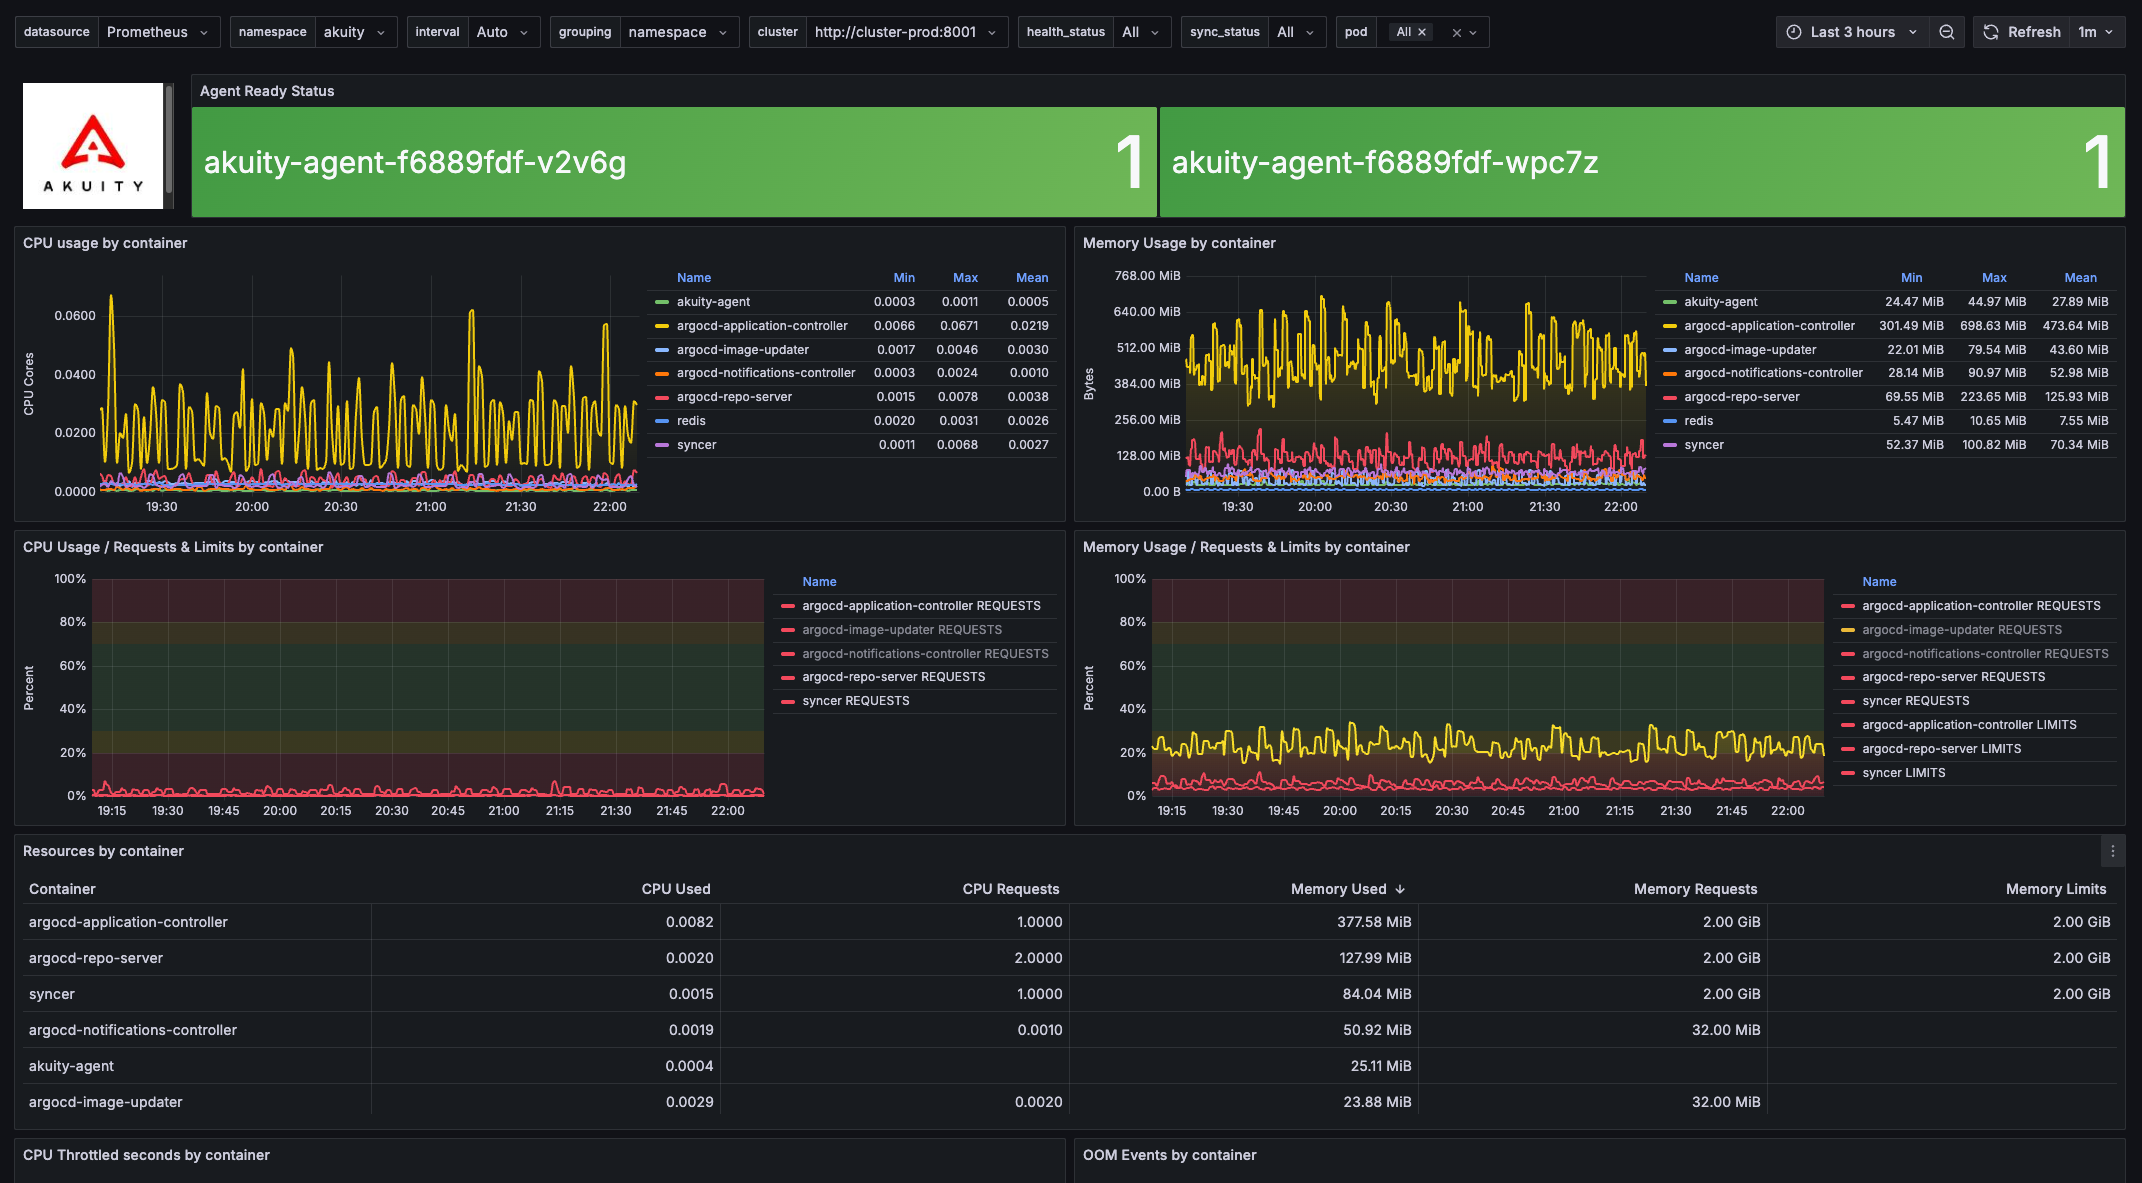
Akuity Managed Cluster Dashboard
A reference Grafana dashboard can be downloaded below to get started: