KubeVision
KubeVision lets you expose the data collected by Argo CD and provides convenient dashboards focused on various use cases listed above. Akuity Platform users won't need to install additional components or even provide configurations to take advantage of the feature.
If you're new to KubeVision, we highly recommend you go through the KubeVision announcement blog post.
Enable the KubeVision Feature
KubeVision feature is only accessible by an Organization owner and not anyone else.
-
Go to your Argo CD Instance and Click on Settings in the top right corner.
-
Search for KubeVision feature in the Feature tab on the left.
-
Enable the KubeVision feature for your Argo CD Instance.
-
Once enabled, it'll list all the clusters configured in your Argo CD Instance. Enable the KubeVision feature for your desired cluster.
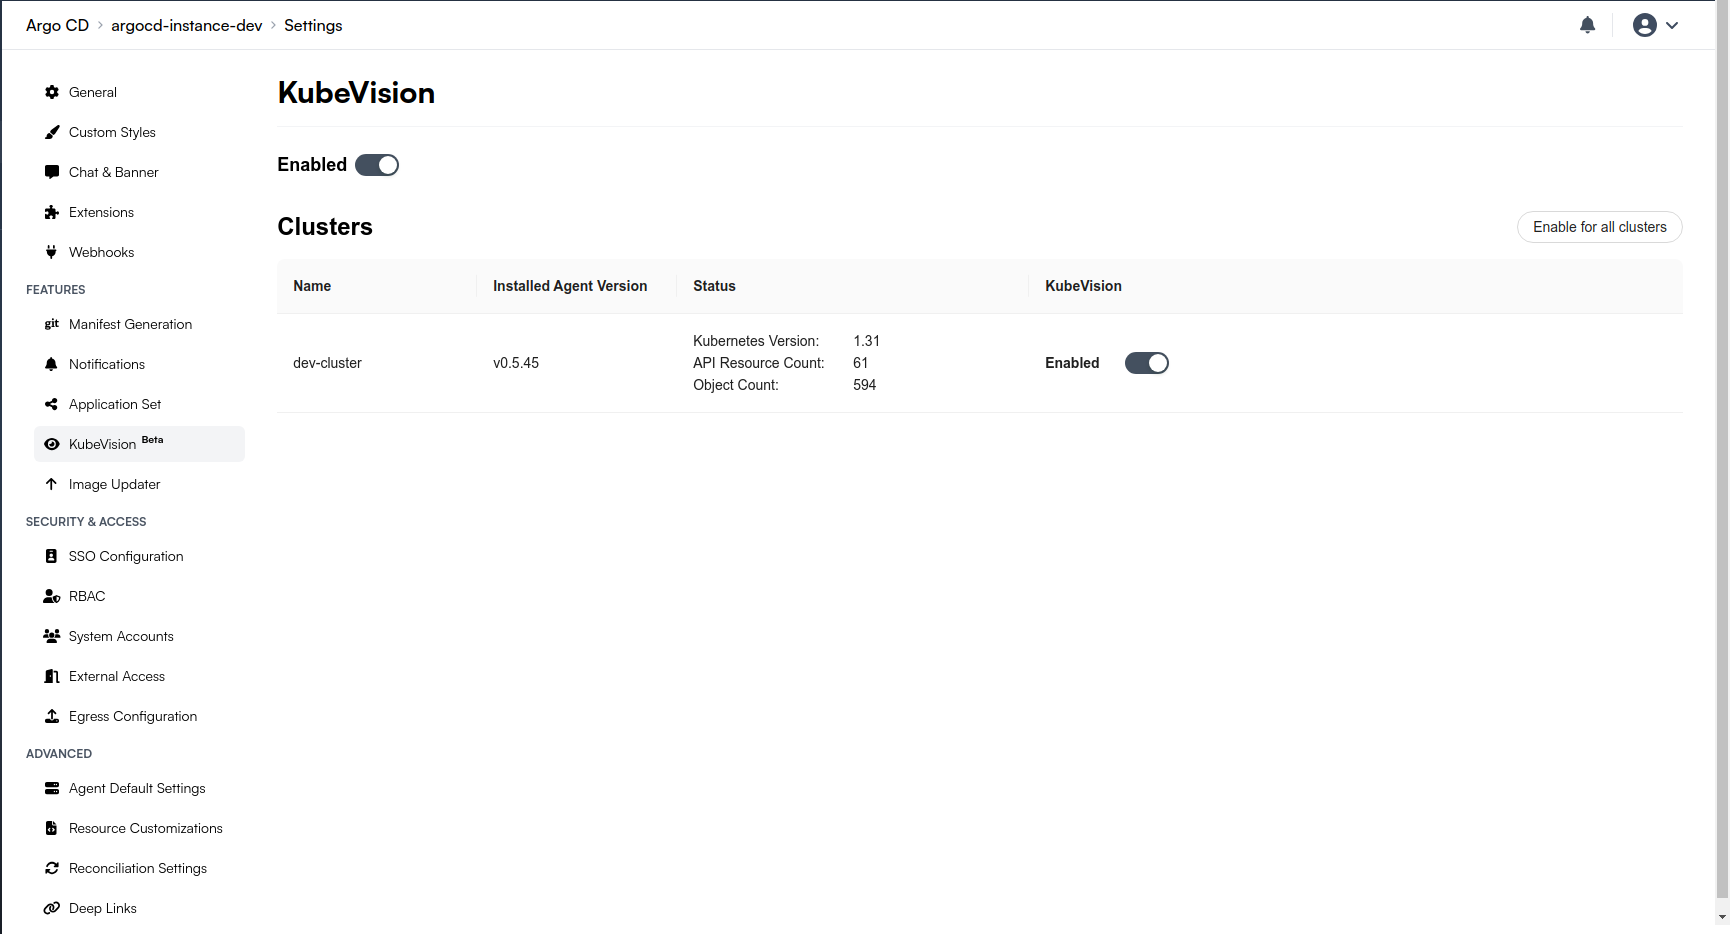
Now that the KubeVision feature has been enabled for the cluster, any applications deployed to that cluster will be monitored by KubeVision. An application needs to be deployed to the Argo CD Instance for KubeVision to work.
Explore the KubeVision Dashboards
Head over to the Argo CD Instance and you'll see the KubeVision tab available above.
The dashboards will take a few minutes to show the data once you've enabled the KubeVision feature.
Explorer Dashboard
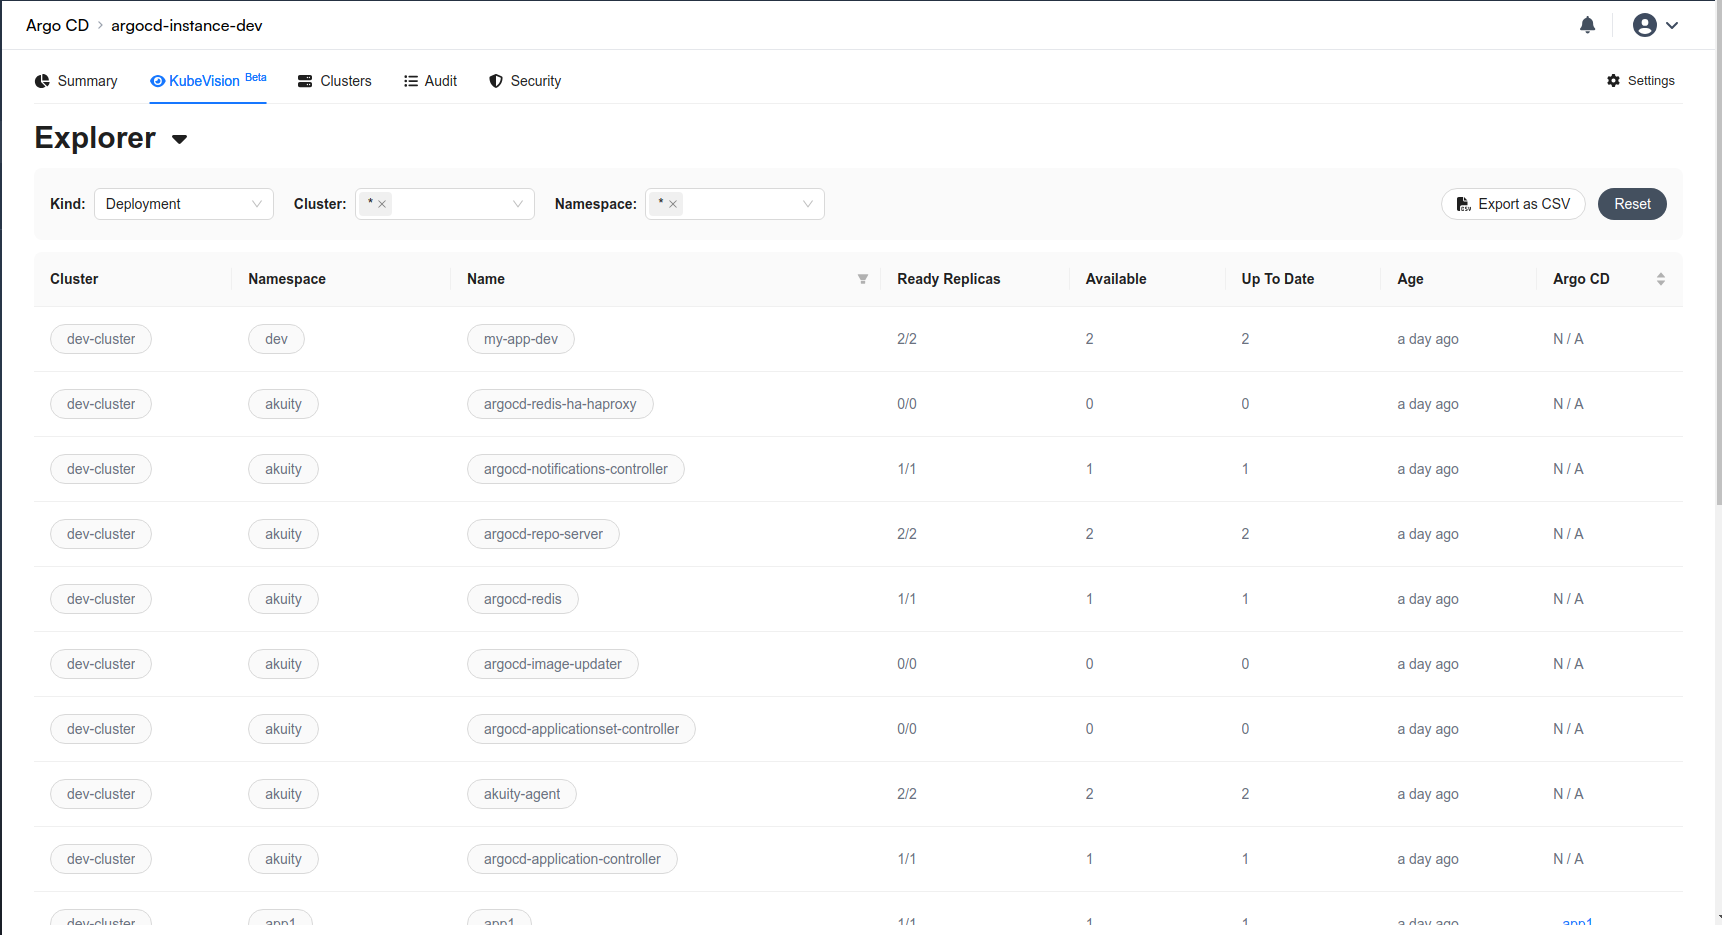
The Explorer Dashbaord allows you to browse through the resources of all clusters connected to the Akuity Platform. It has information about the parent-child relationships between resources, enabling you to start from top-level resources such as Deployments and drill down into lower-level resources like ReplicaSets and Pods.
You can filter out the resources by changing their Kind or by changing the namespace or changing the cluster for each dashboard.
Container Dashboard
The Container Dashboard provides a centralized view of all the containers within the desired cluster. It lists each container along with critical information such as the associated cluster, container name, pod details, and the current status (e.g., Running, Completed). The dashboard also offers insight into resource allocation, showing memory and CPU limits and requests, which helps operators manage resources efficiently and avoid overconsumption. With filtering options for specific clusters and the ability to export the data as CSV, this tool is highly beneficial for scaling environments.
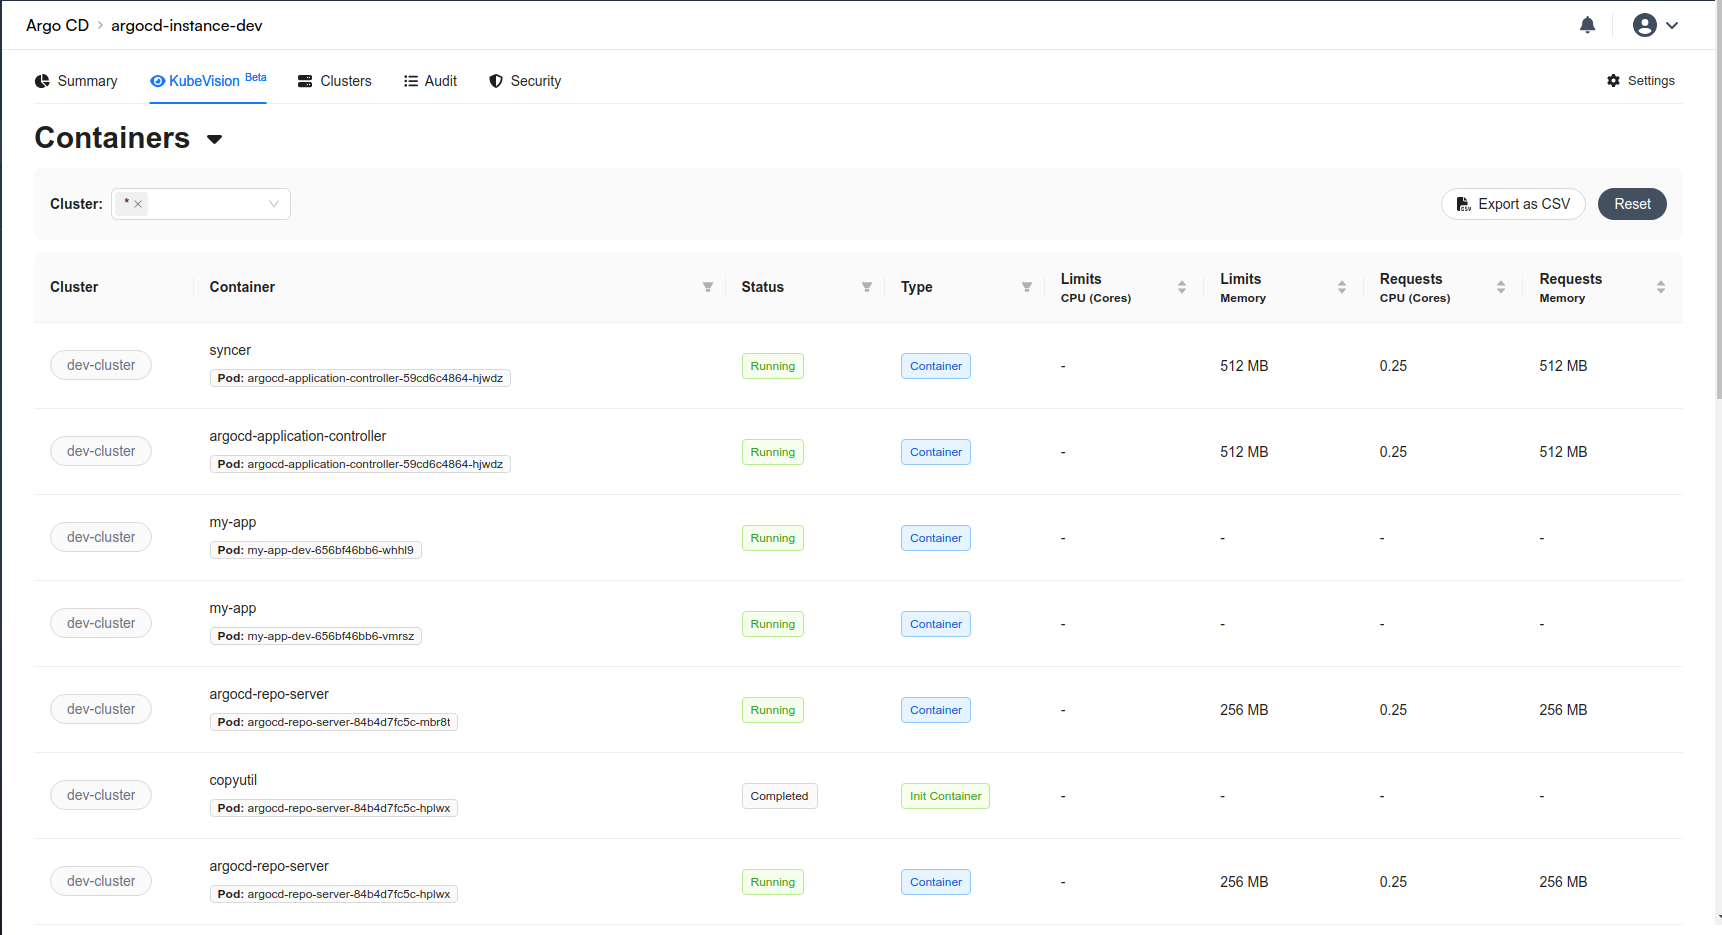
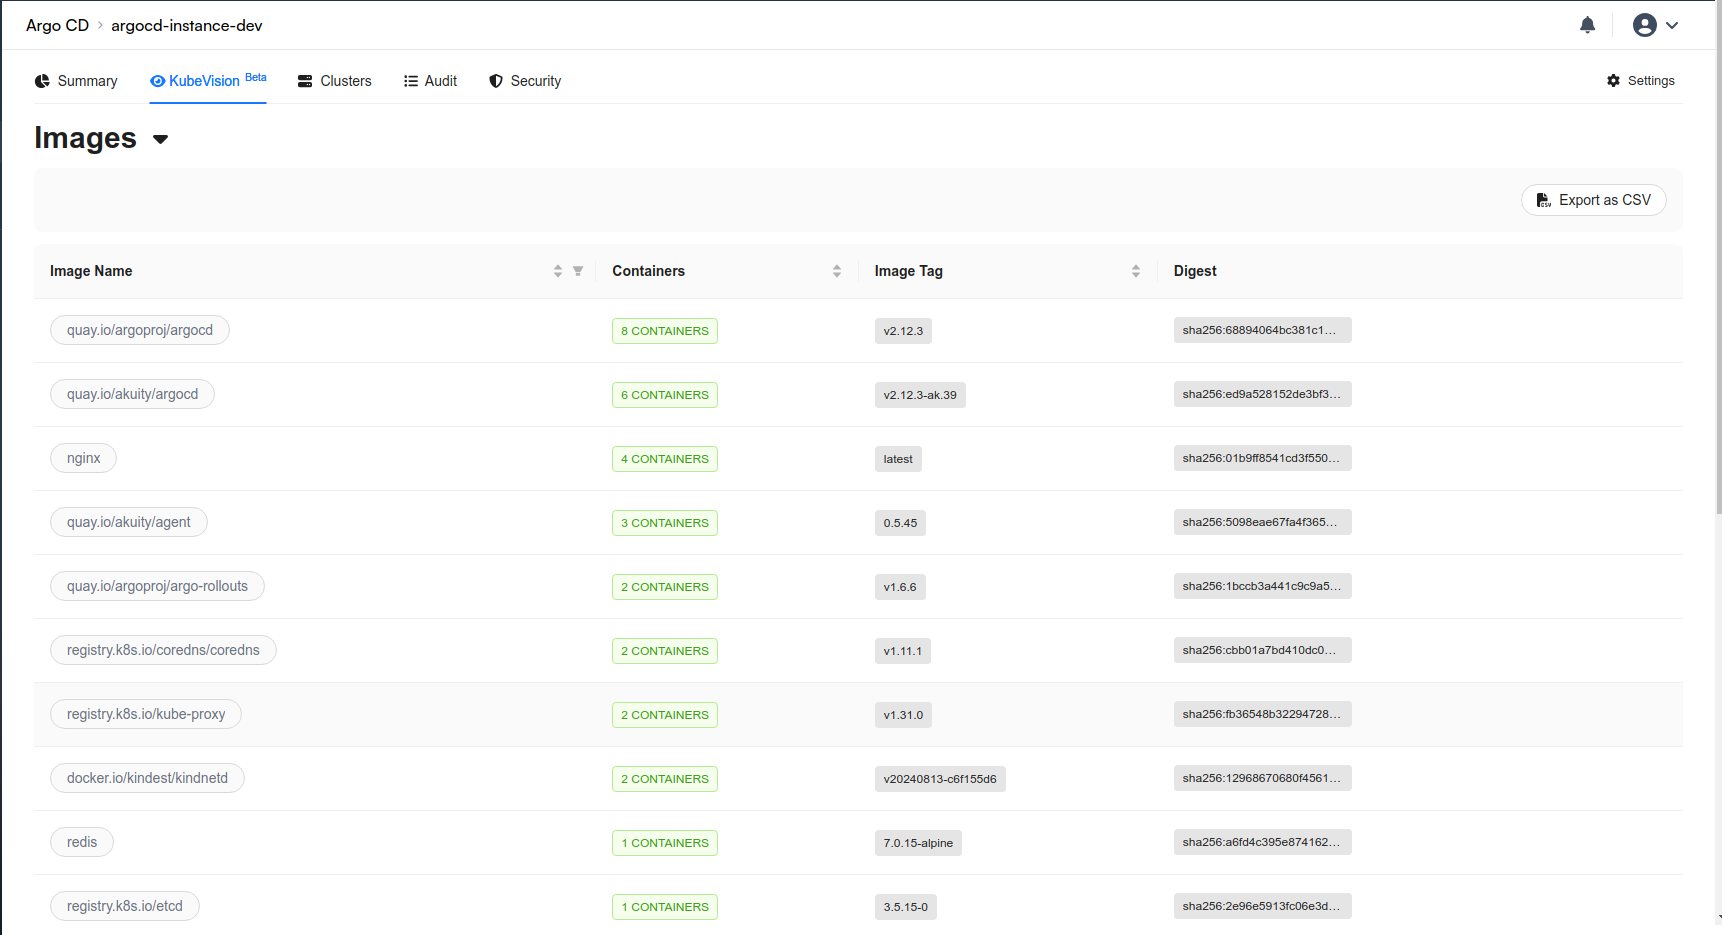
Image Dashboard
The Image Dashboard provides an overview of the container images being used within the Kubernetes environment. It displays key information such as the image name, the number of containers using each image, the image tag, and the image digest, which is a unique identifier for the specific image version. This dashboard is crucial for managing and tracking container images across different applications and environments, ensuring that the correct image versions are deployed consistently. It also helps in identifying any outdated or vulnerable images that may need updating.
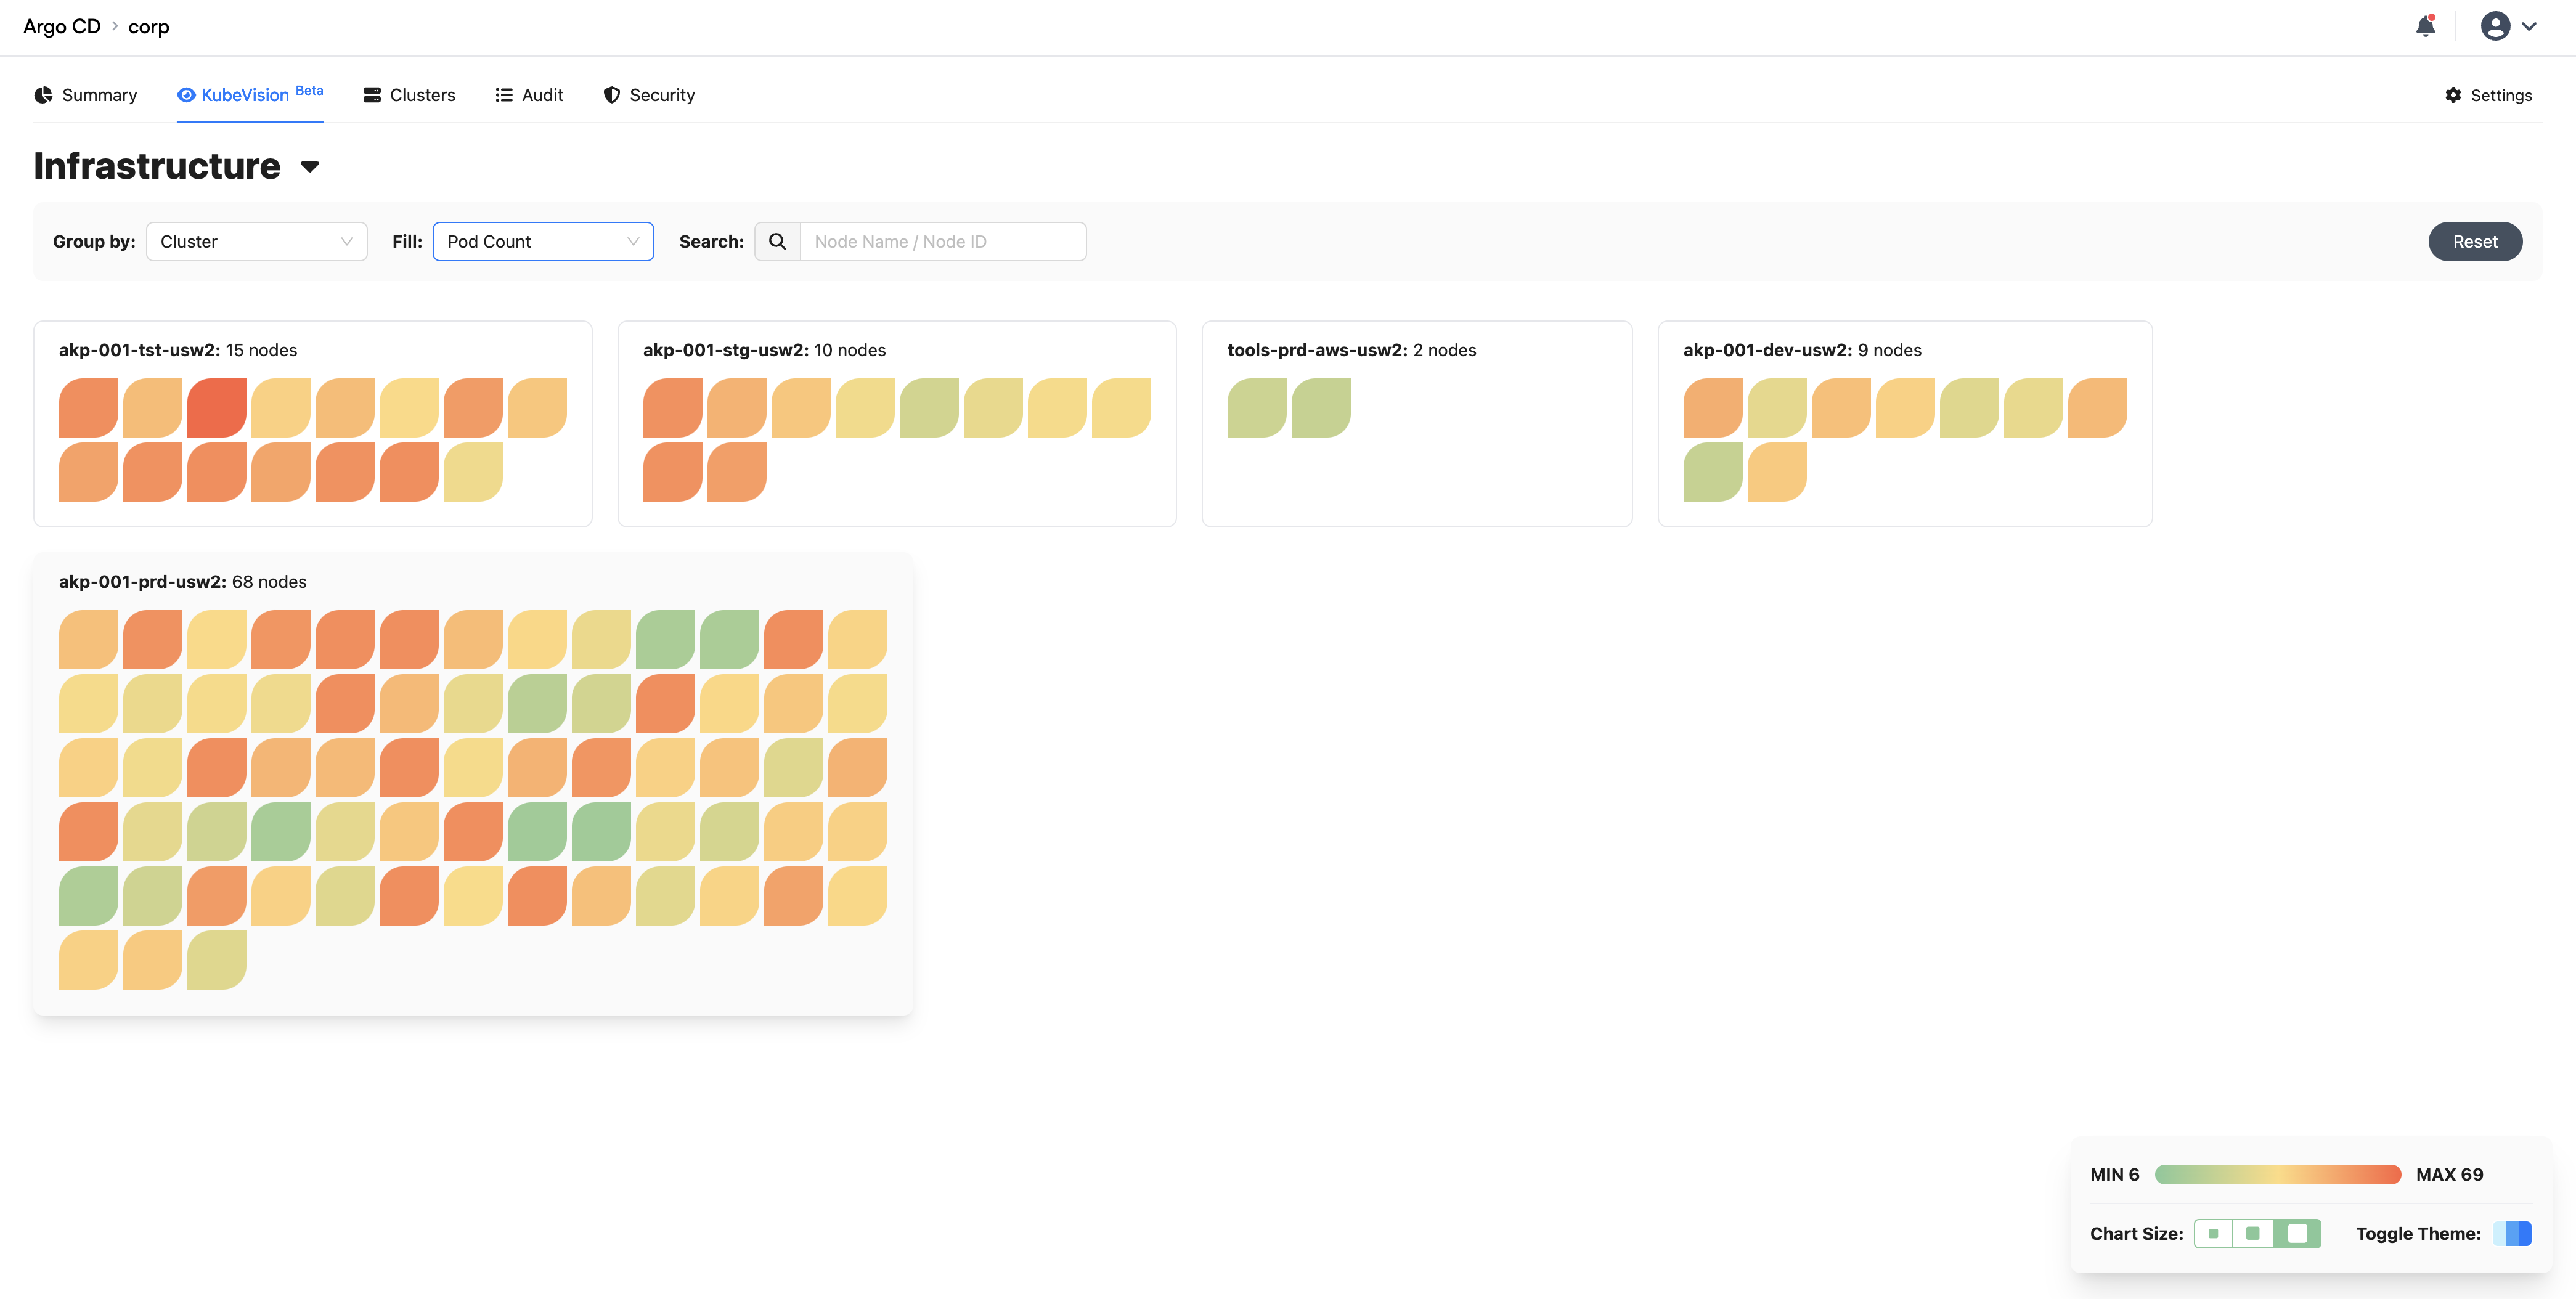
Infrastructure Dashboard
The Infrastructure Dashboard in Argo CD offers a dynamic visual representation of the current state of your Kubernetes clusters. It enables monitoring and managing pod utilization, cluster health, and resource allocation. You can search for the node whose metrics you'd like to fetch.
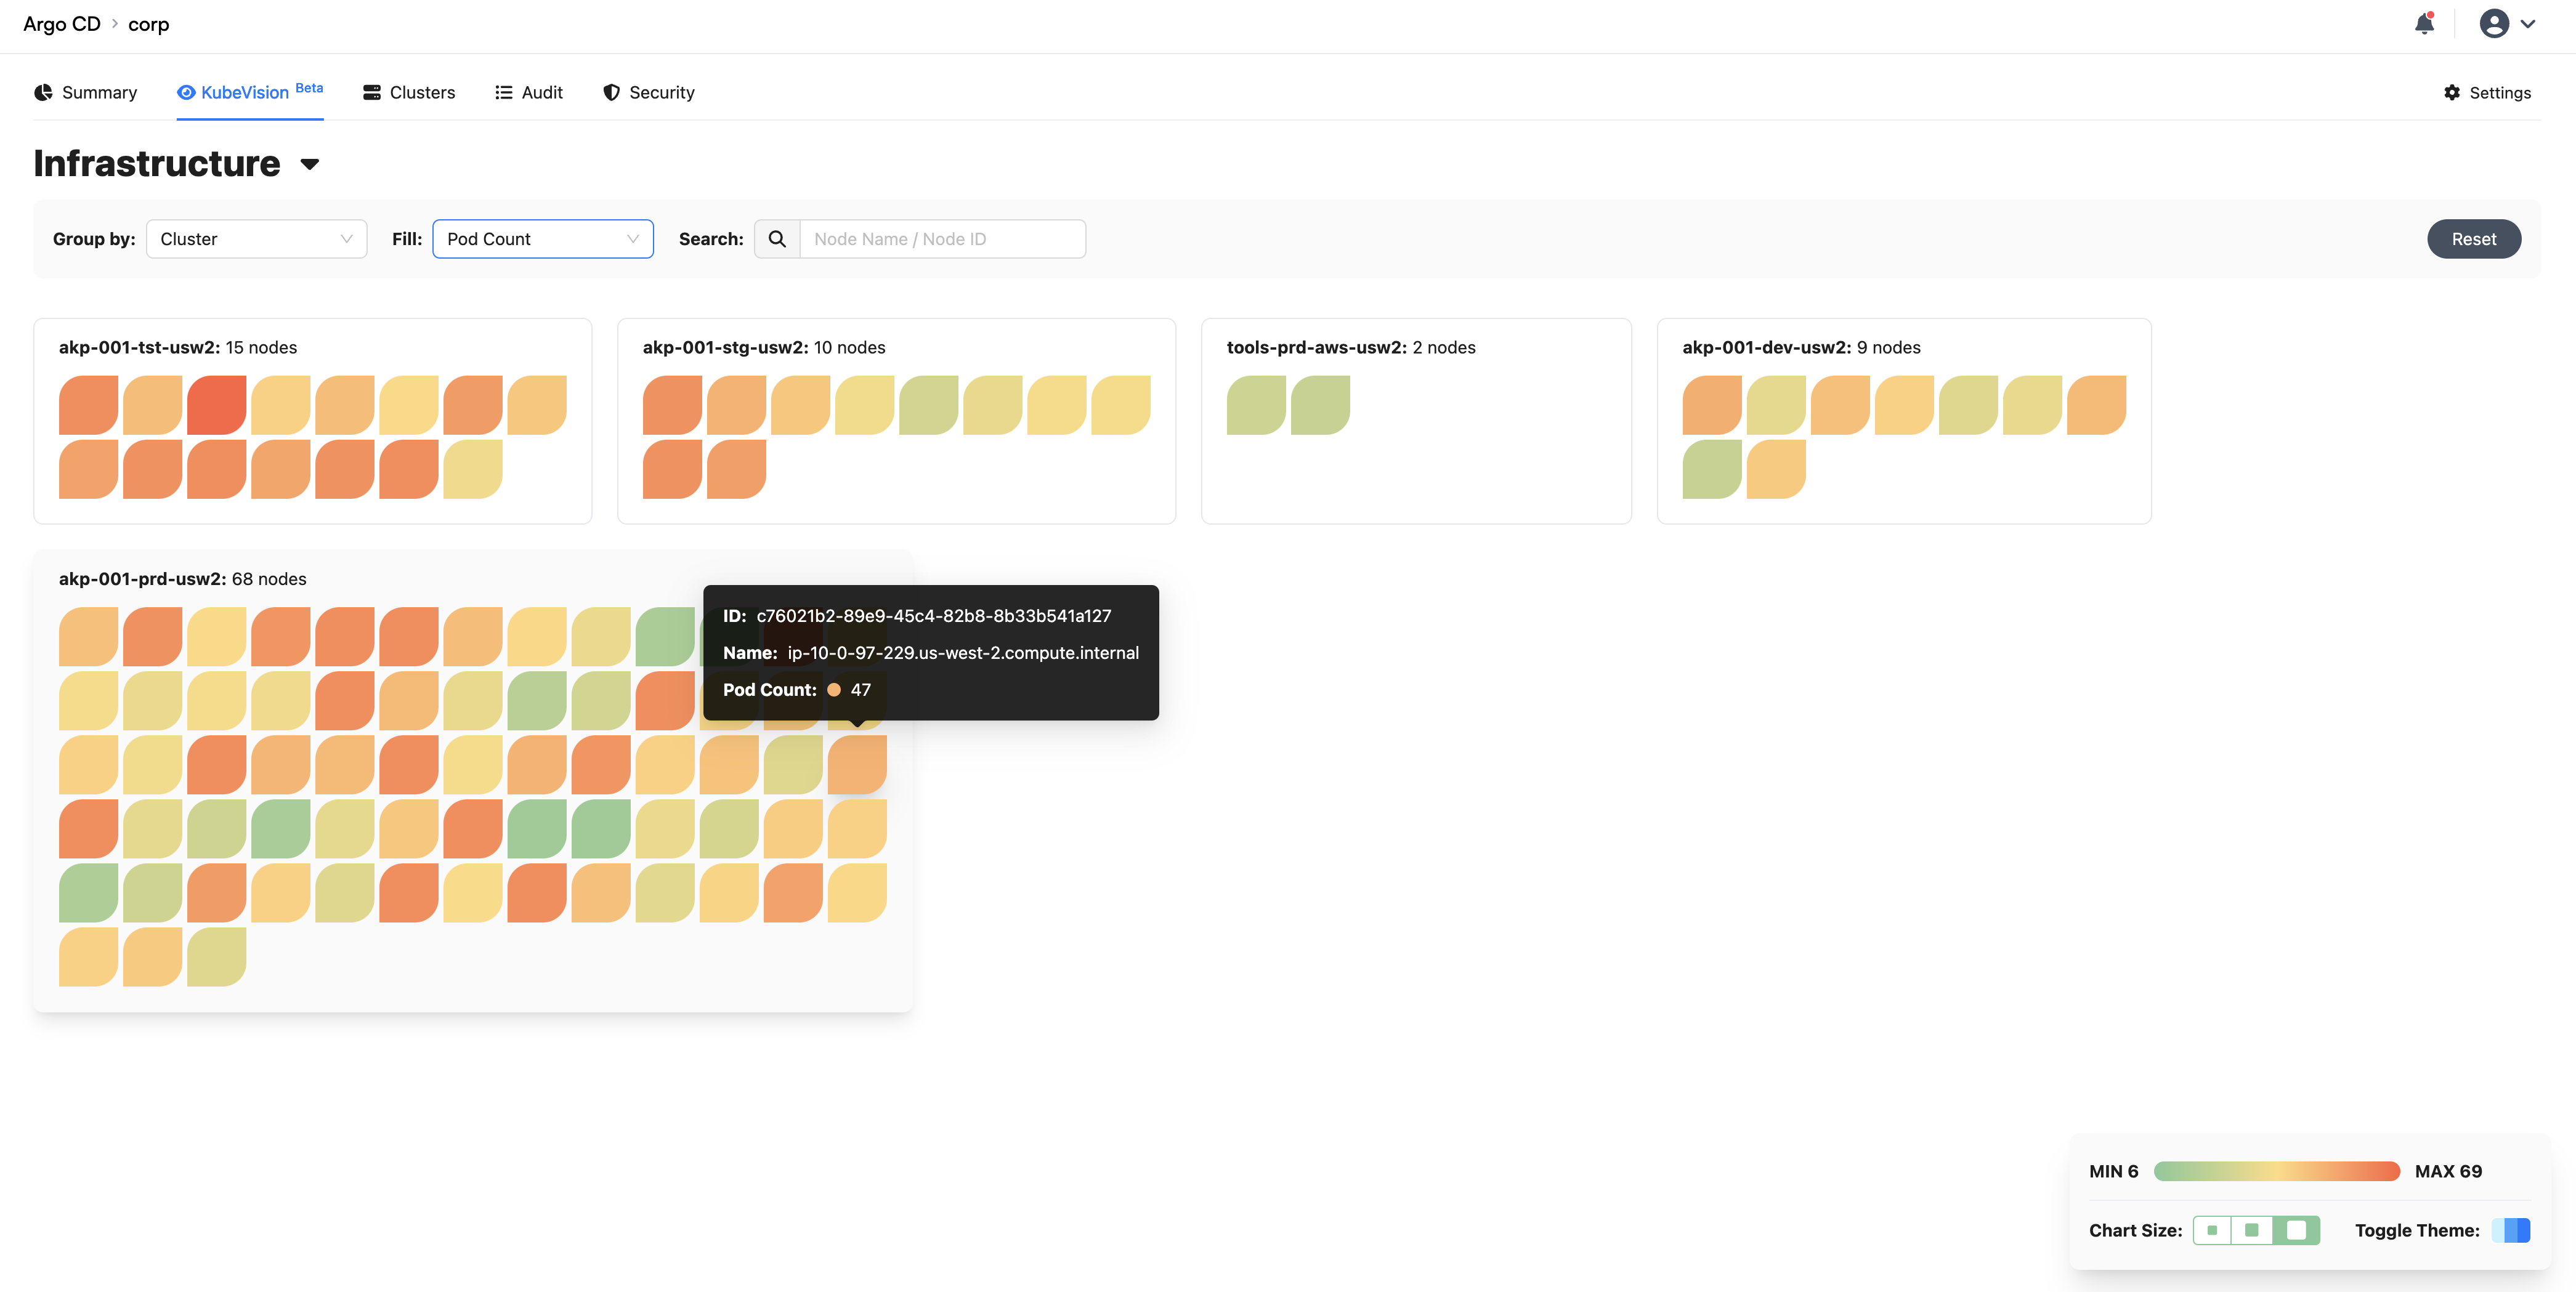
Once the filters have been set, you can hover over to the node and it'll give you details about the metrics you've set.
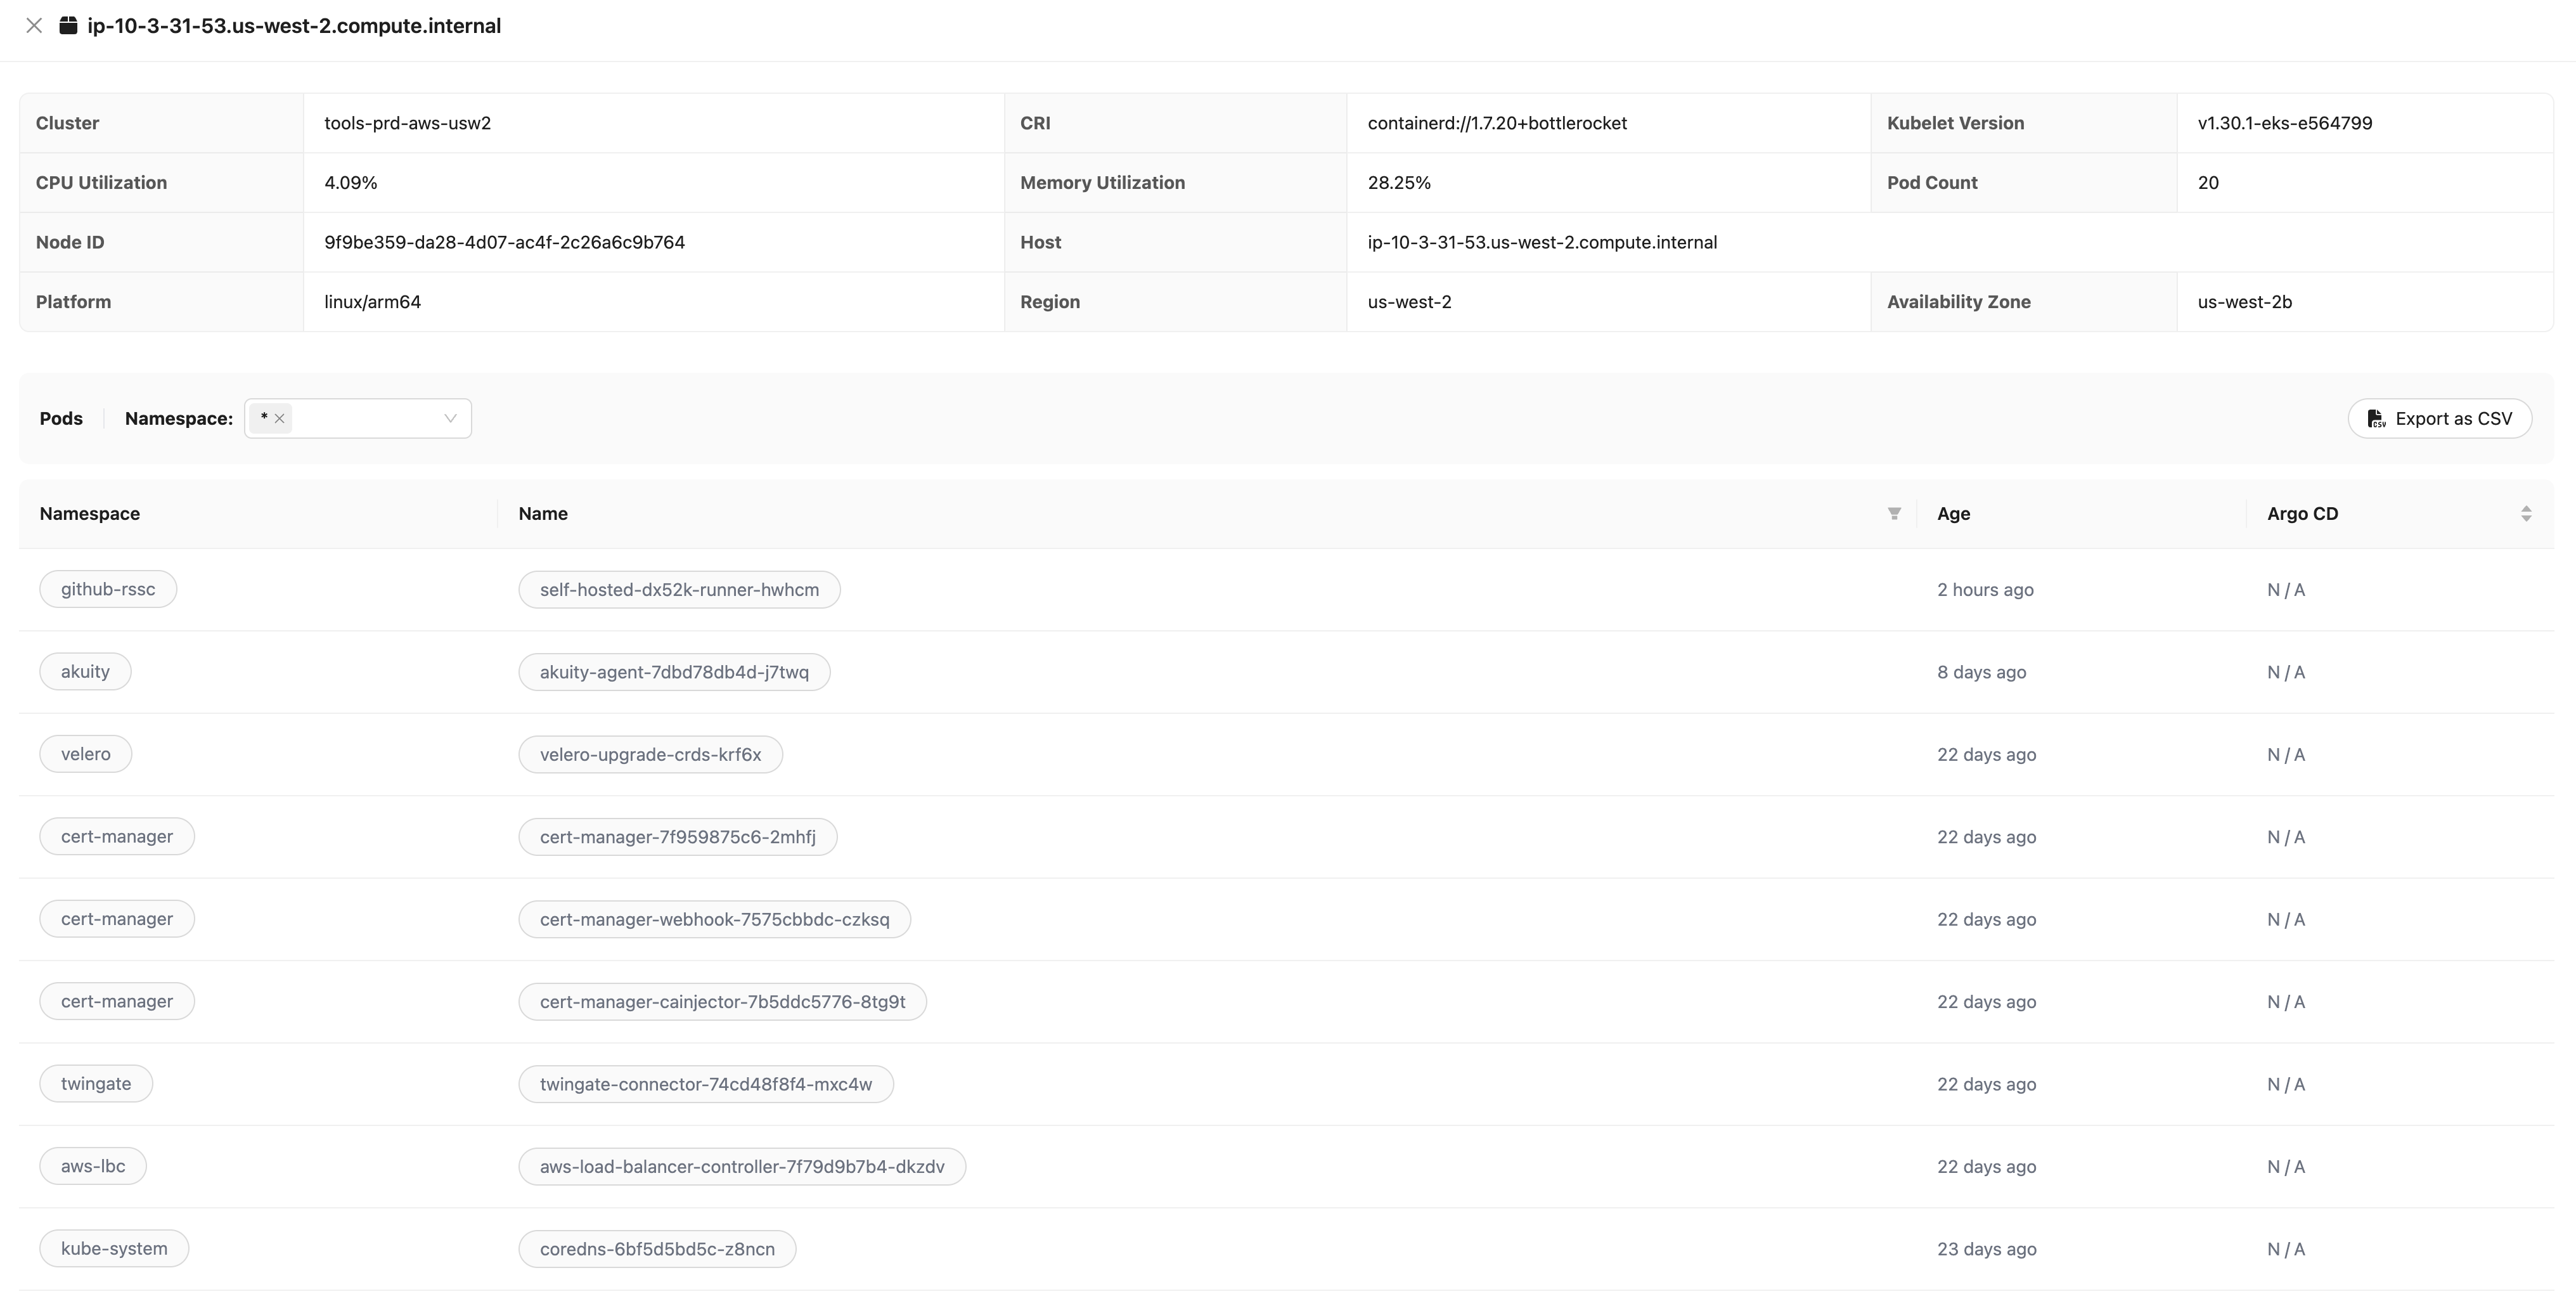
You can also get the details about the nodes by clicking on the node icon itself.
AI Assistant
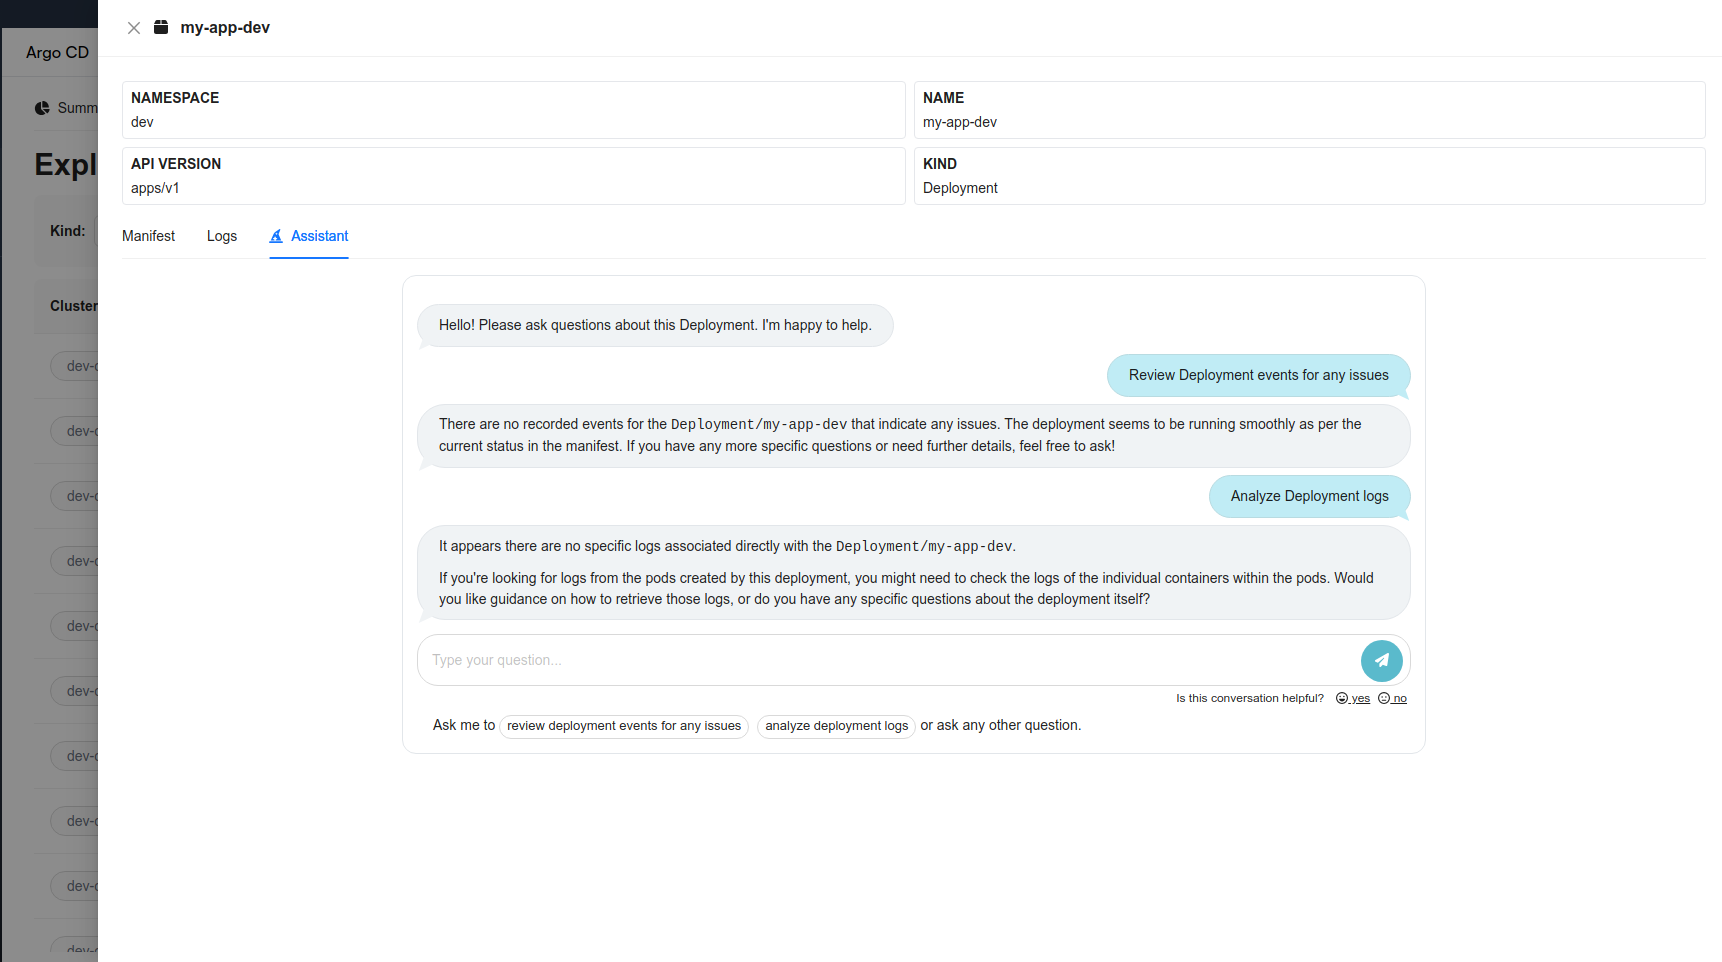
The AI Assistant feature is already available through the Argo CD extension. The new KubeVision feature further enhances the AI Assistant’s capabilities, providing Akuity Platform users with deep insights into all their Kubernetes resources.
Go to the Explorer Dashboard and click on any resource name you'd like to get AI assistance with.
